Dashboards are critical to service industry. By creating this tool, we would save hundreds of man-hours by automating report creation, offering real-time monitoring instead of daily status reports and create a subscription-based alerts system that was a bottleneck in response time.
Existing system
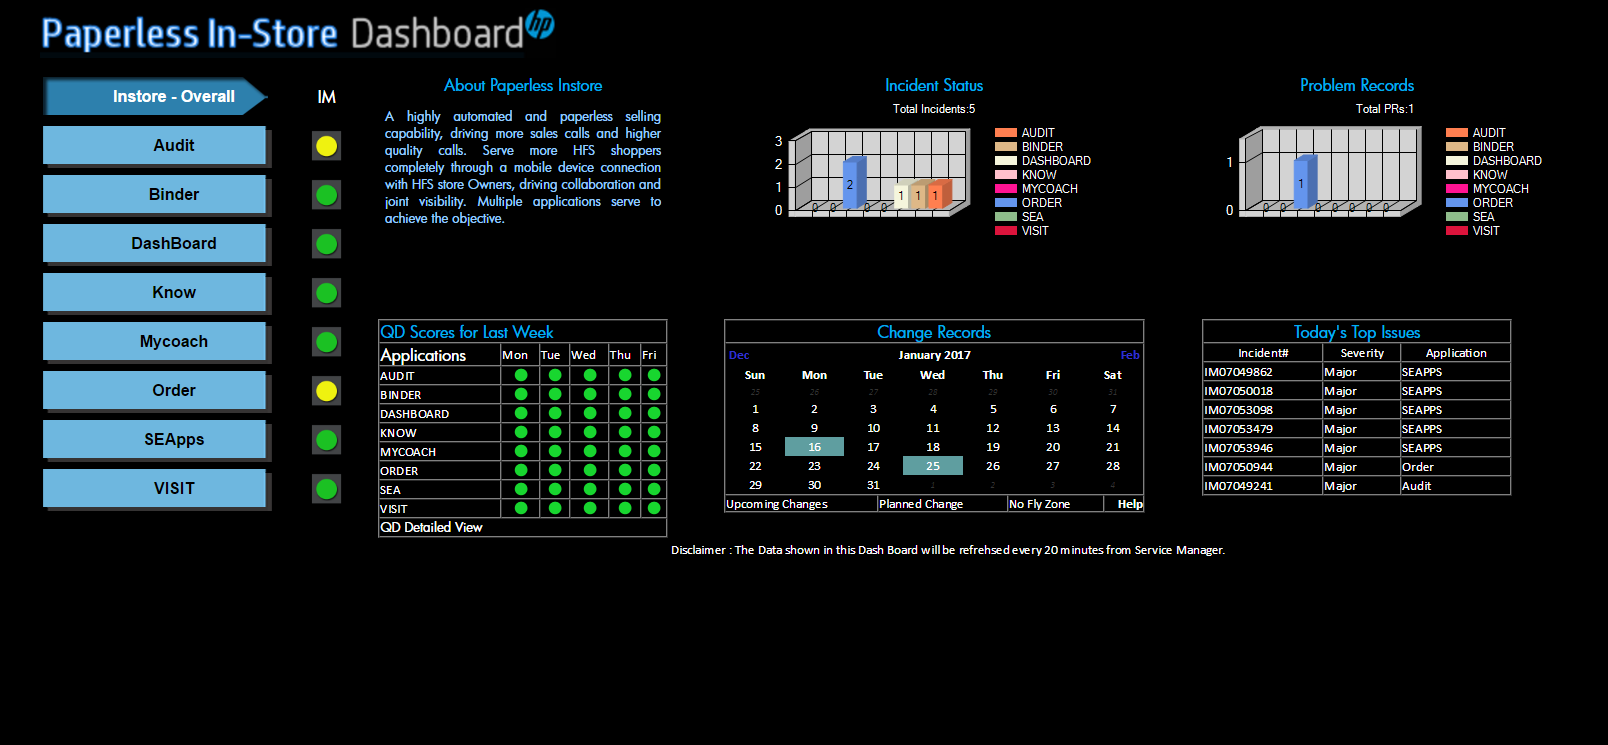
When we started working on the system, there was a primitive system that acted as a dashboard for our applications, and was not visually pleasing or provided as many features.
The old dashboard
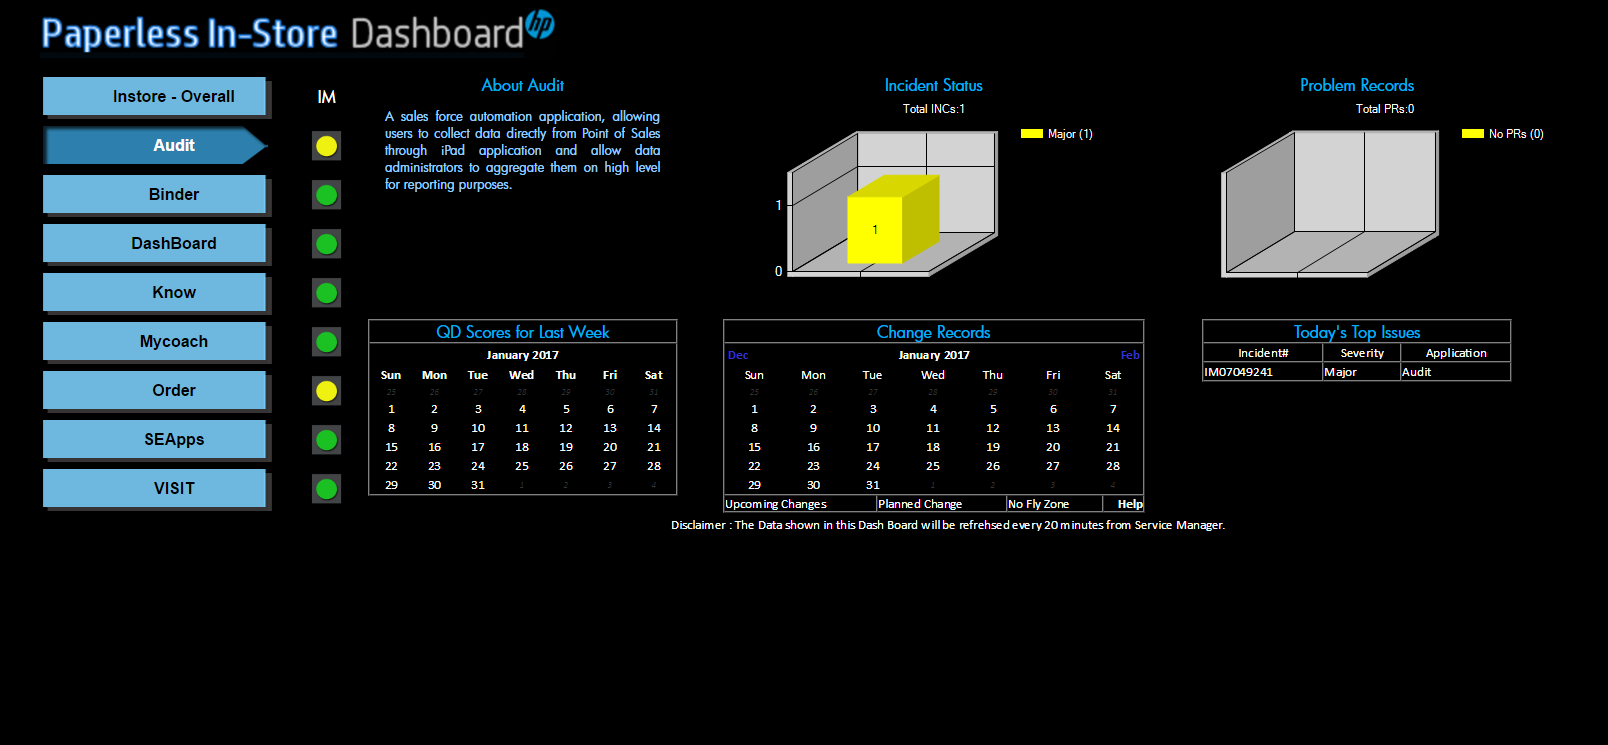
Old application drilldown
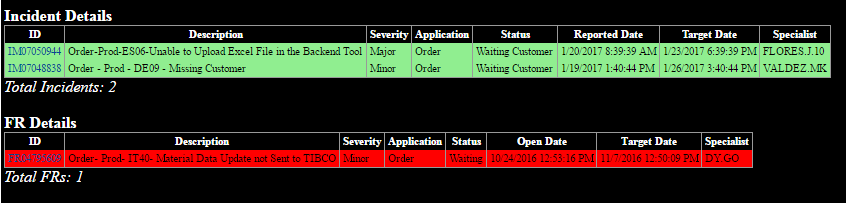
Old details drilldown
Early efforts
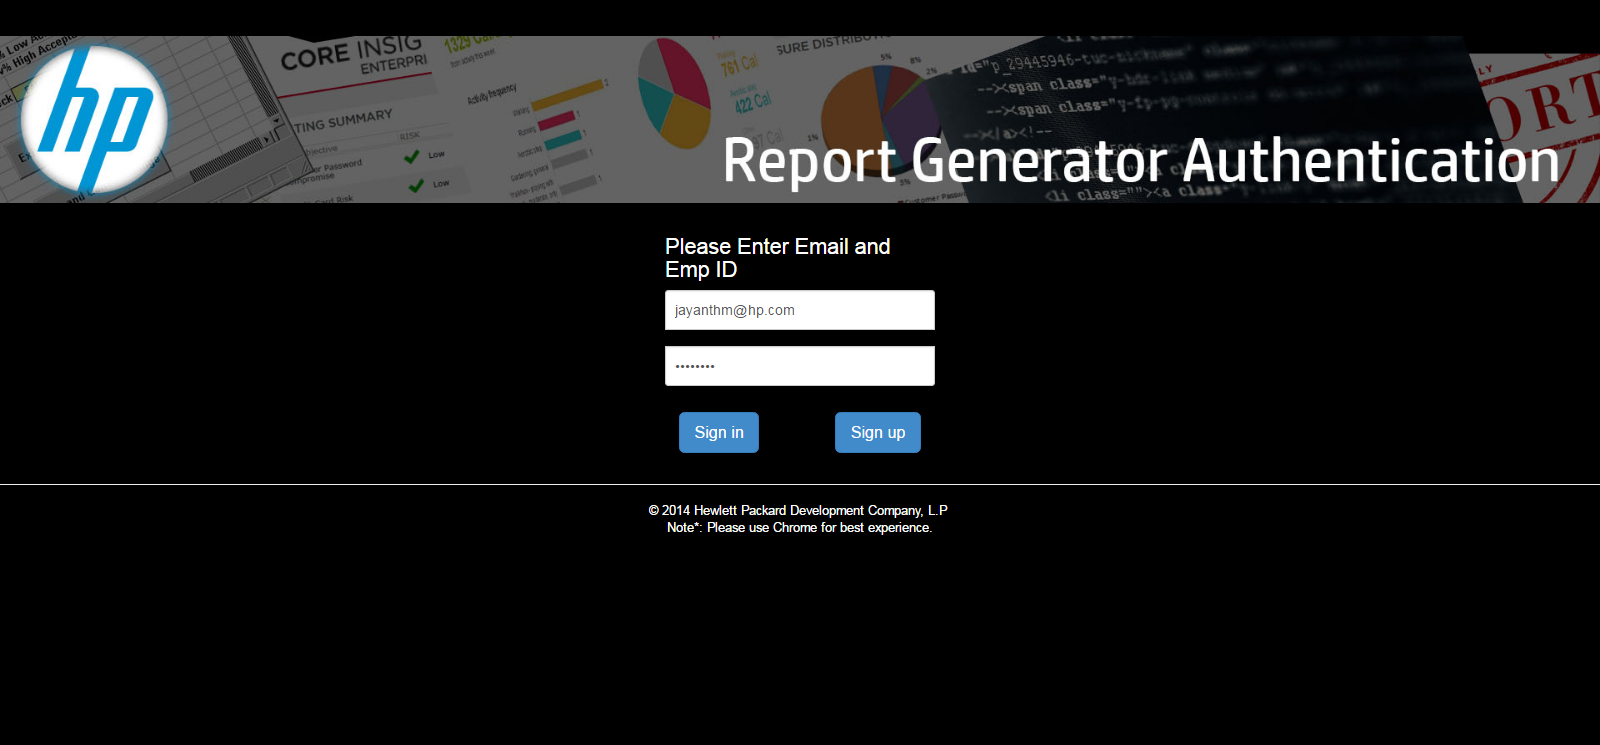
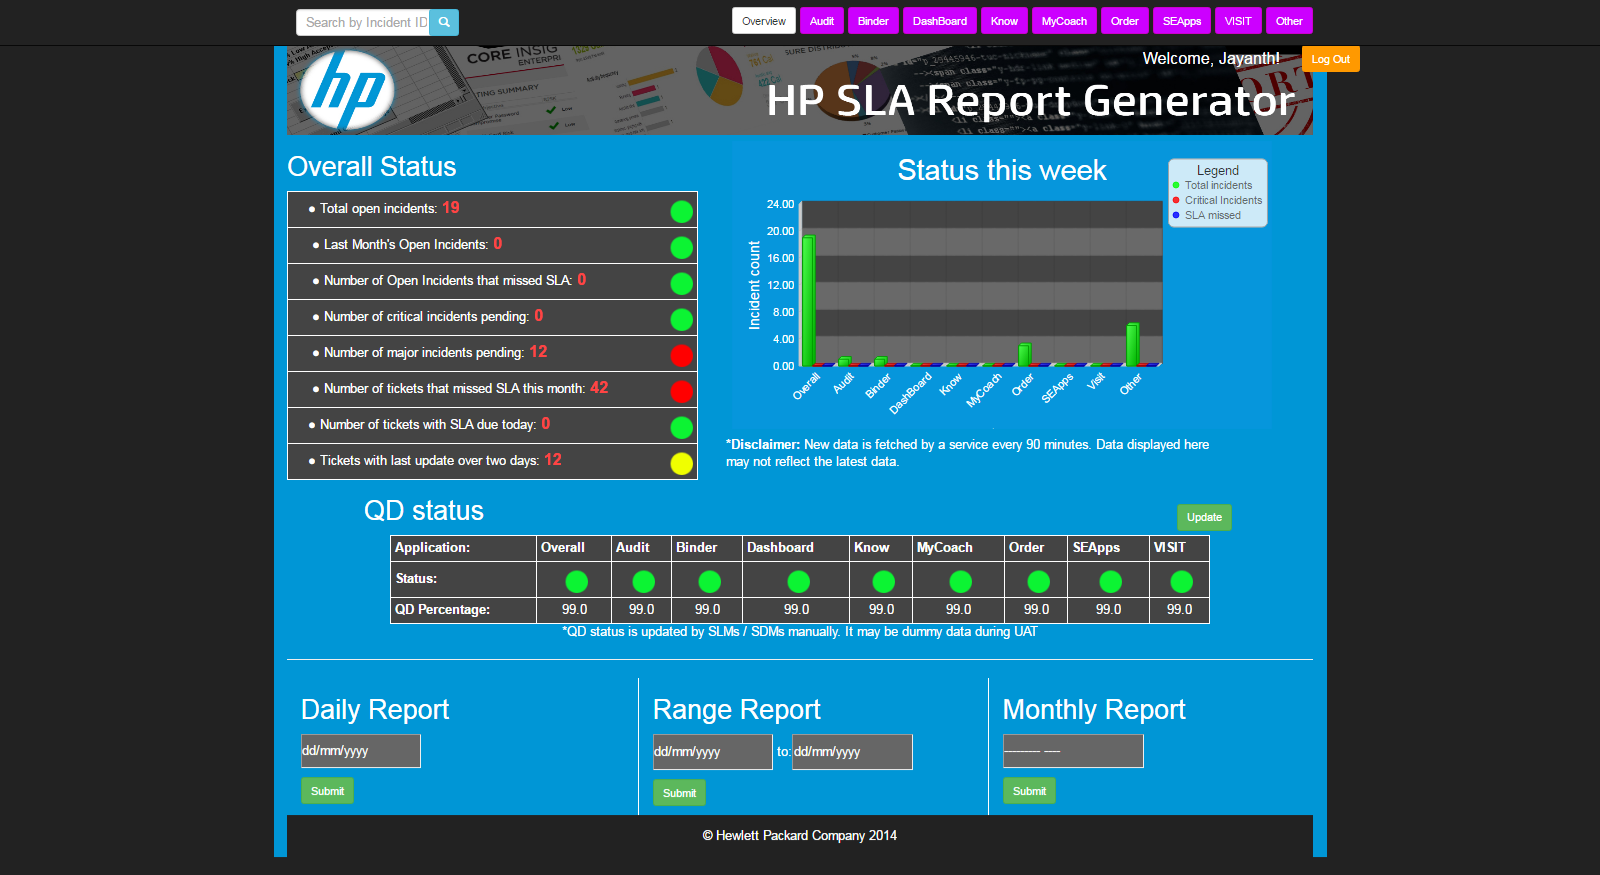
Initially, we wanted to just replicate the existing system in HTML and Java, and provide an on-demand report generator integrated into the dashboard. However, the resulting system did not turn out to be as visually stimulating as we expected it to be, and we hit some roadblocks with the technology stack we had chosen (JSP, ugh!) and ran into a lot of code maintenance issues.
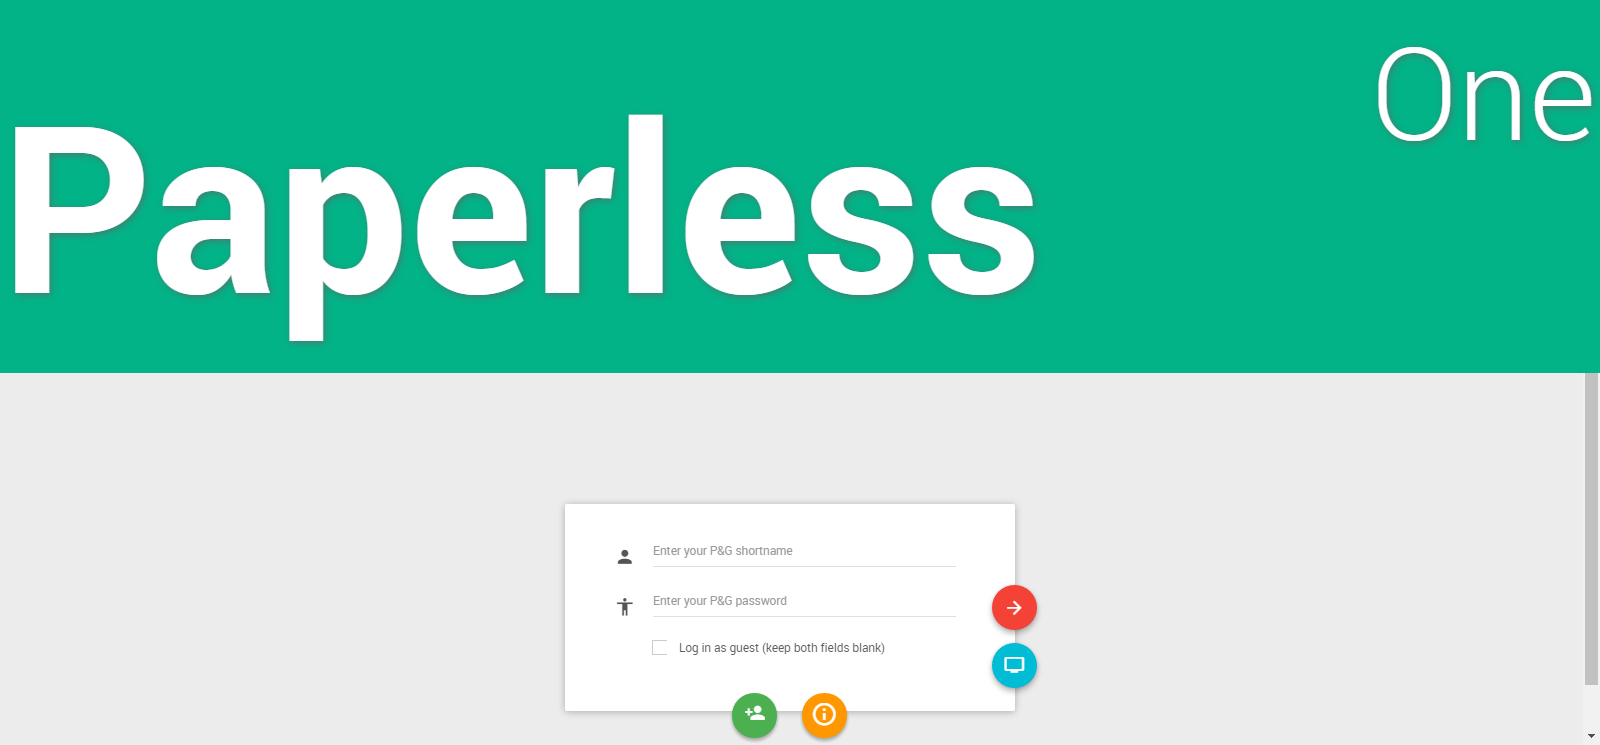
The login screen
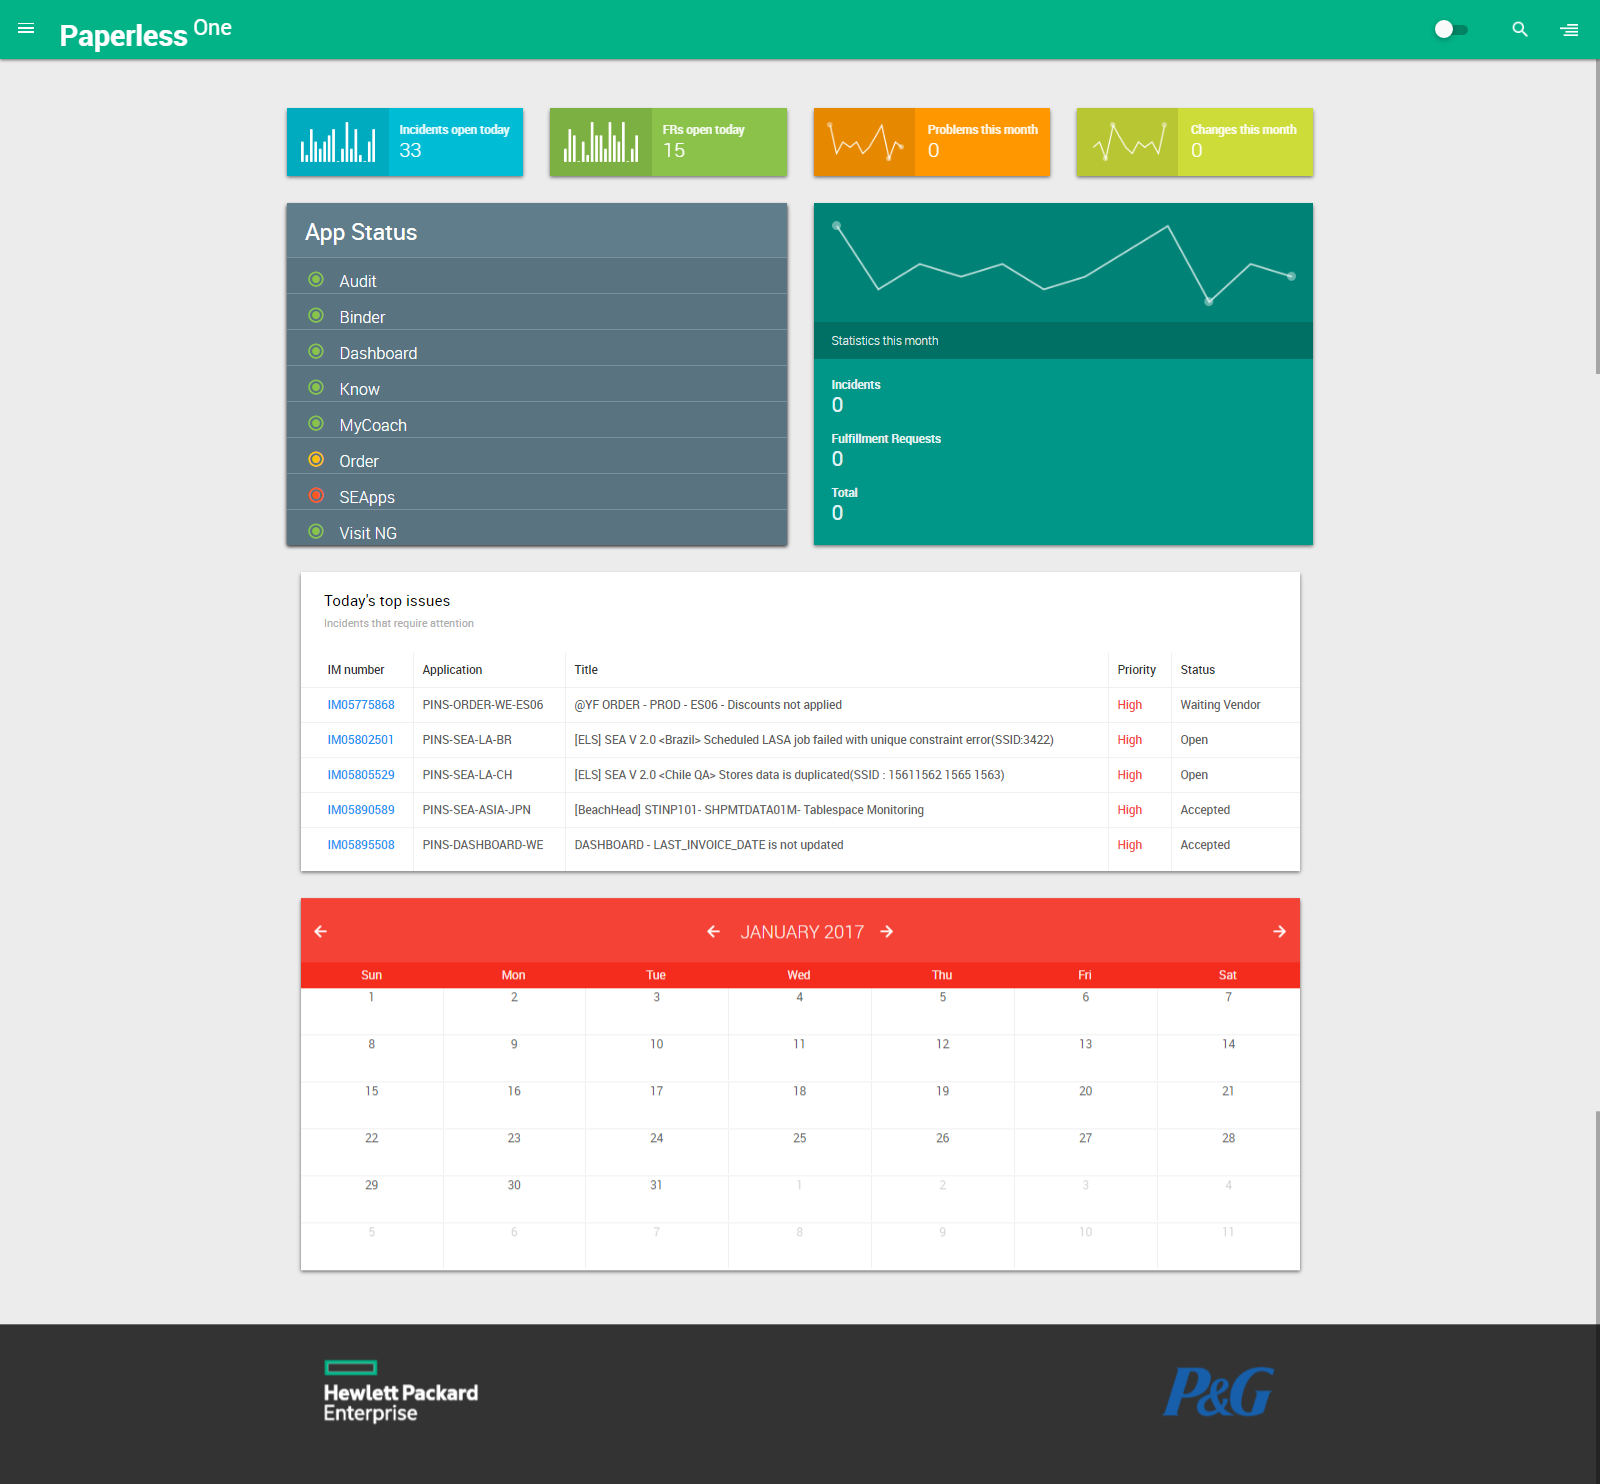
The dashboard view
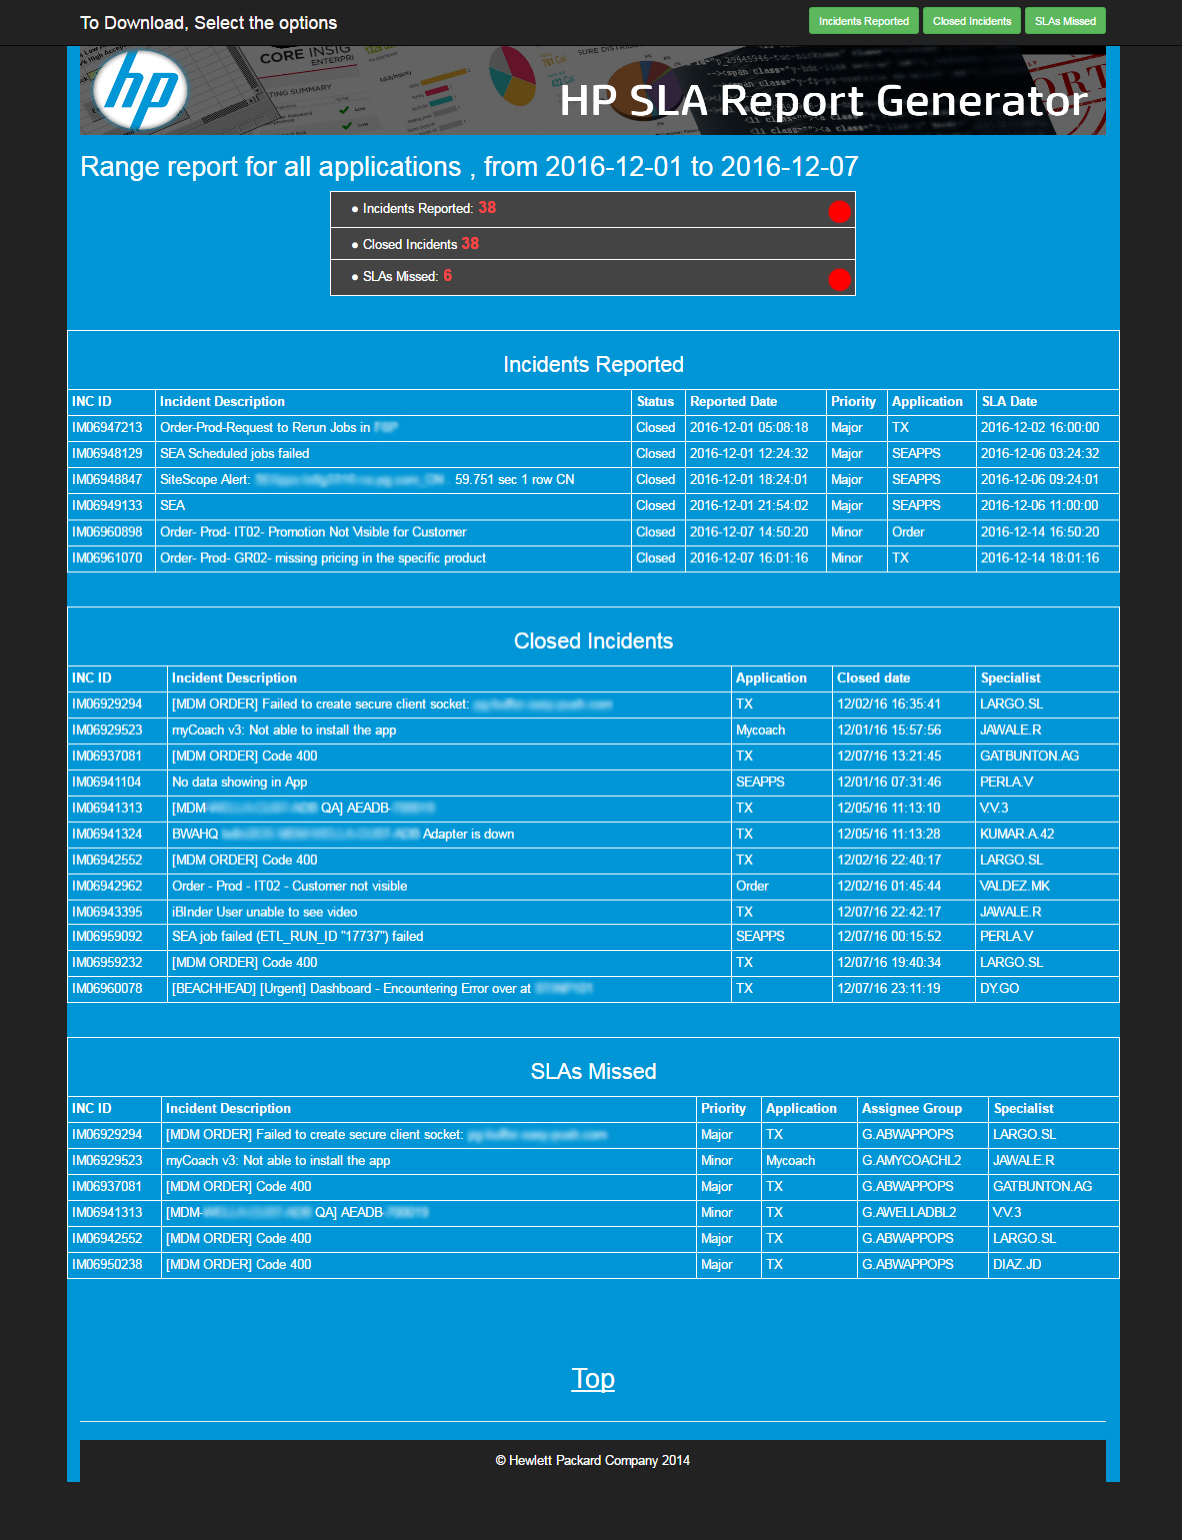
Reports and export
Planning
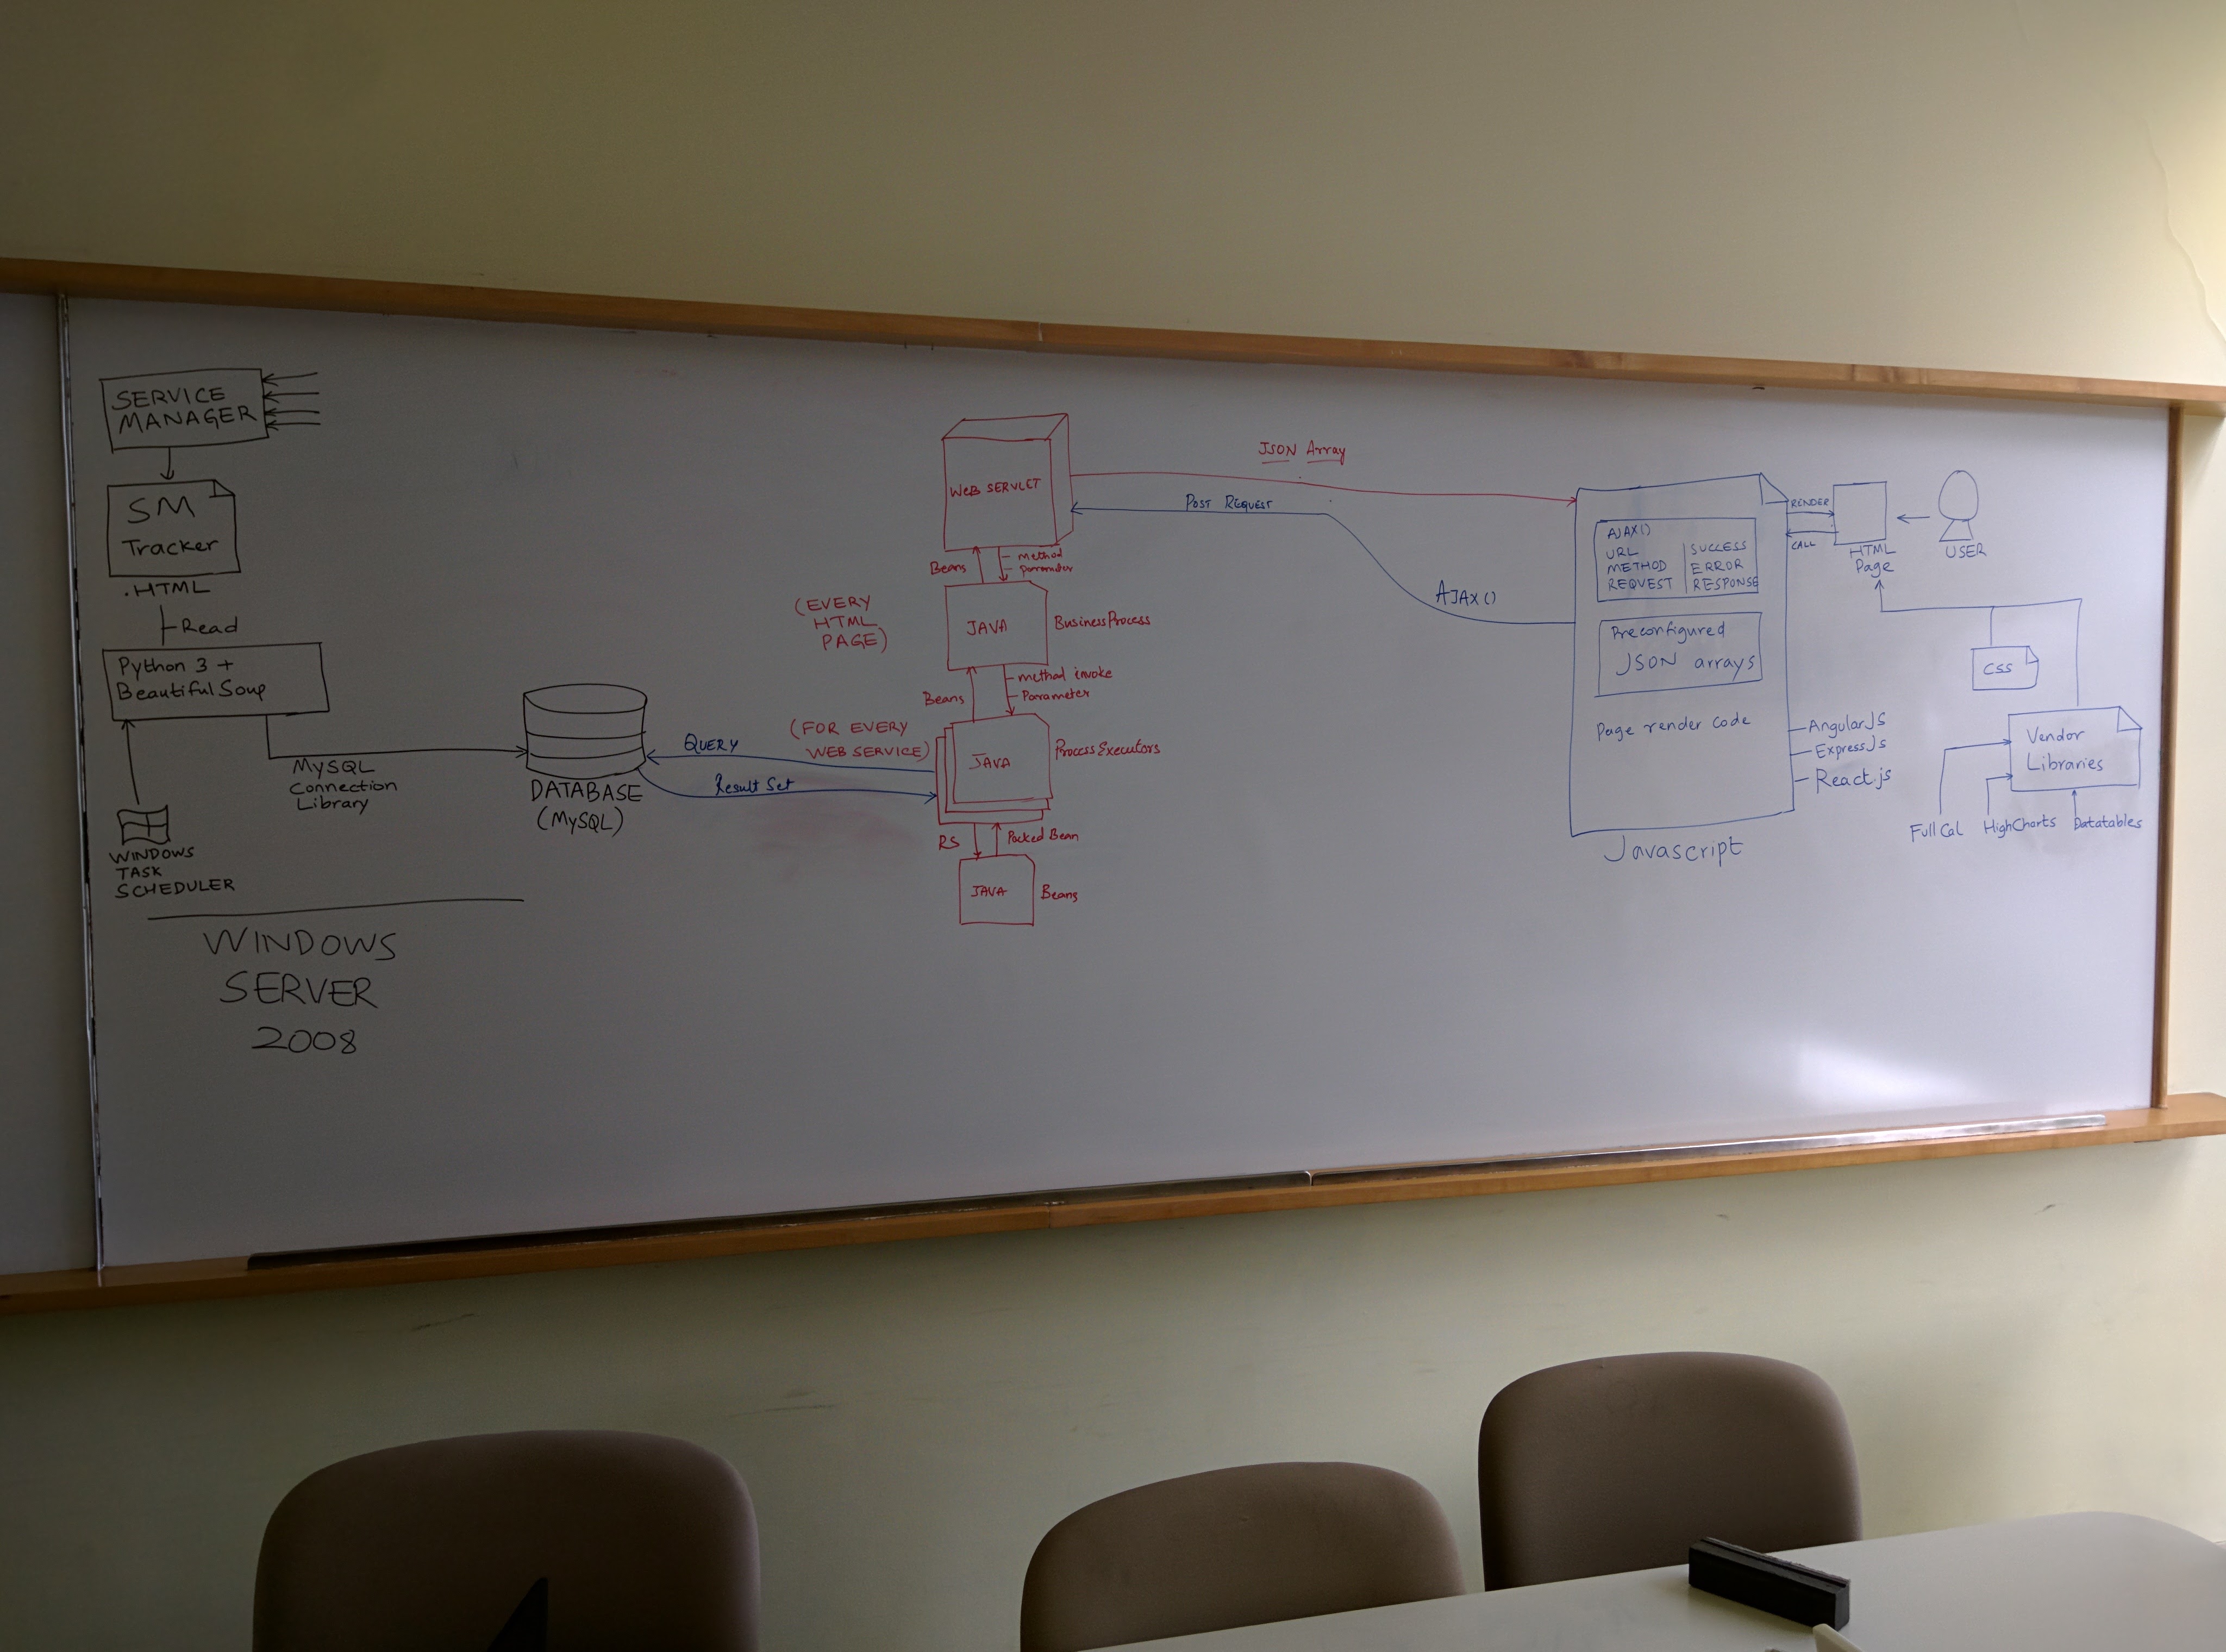
Determined to write the most maintainable code we could muster, we started planning the architecture for modularity and modern technology. The backend and frontend would be decoupled with AJAX calls and REST services, and since a database was not available, we had to find ways around it to get data in to the system - which meant resorting to a web scraper with Python's BeautifulSoup library.
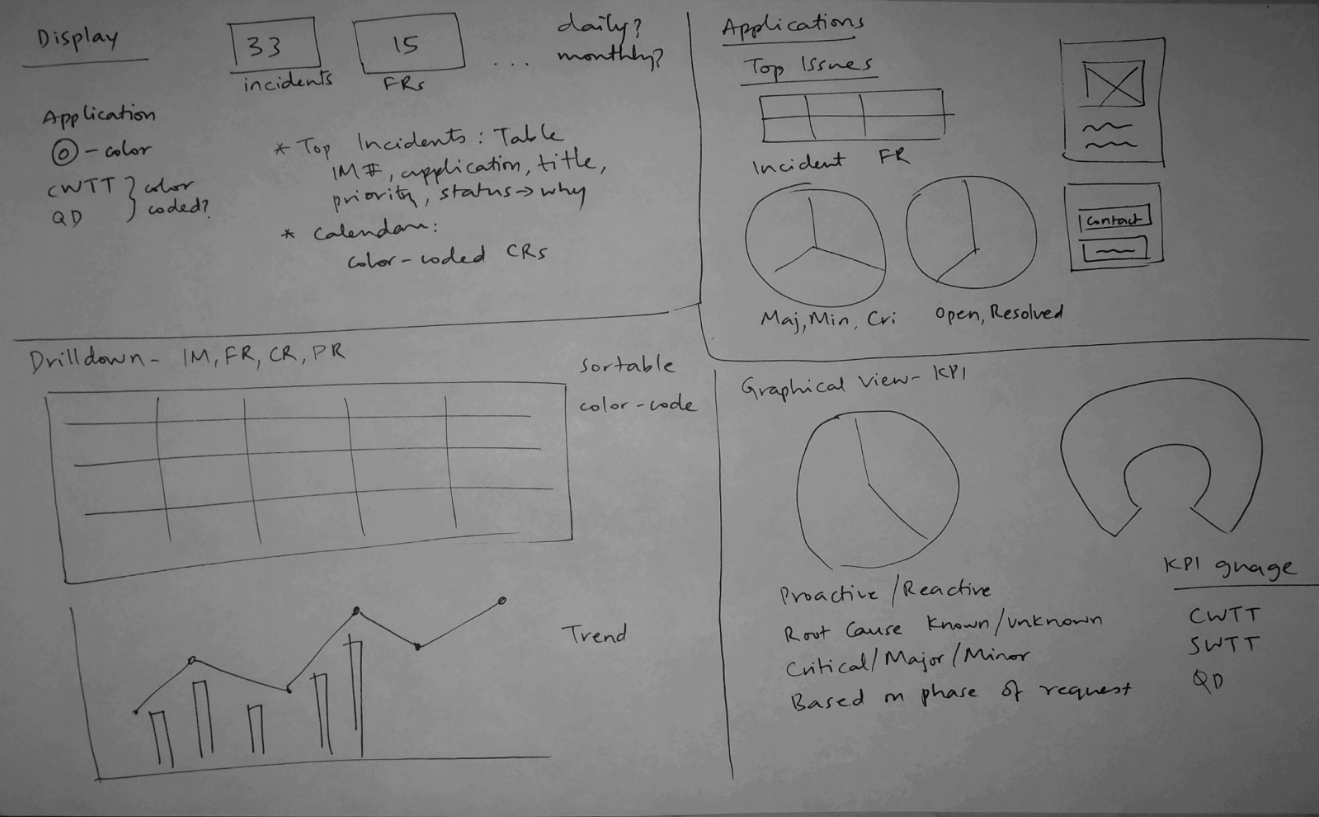
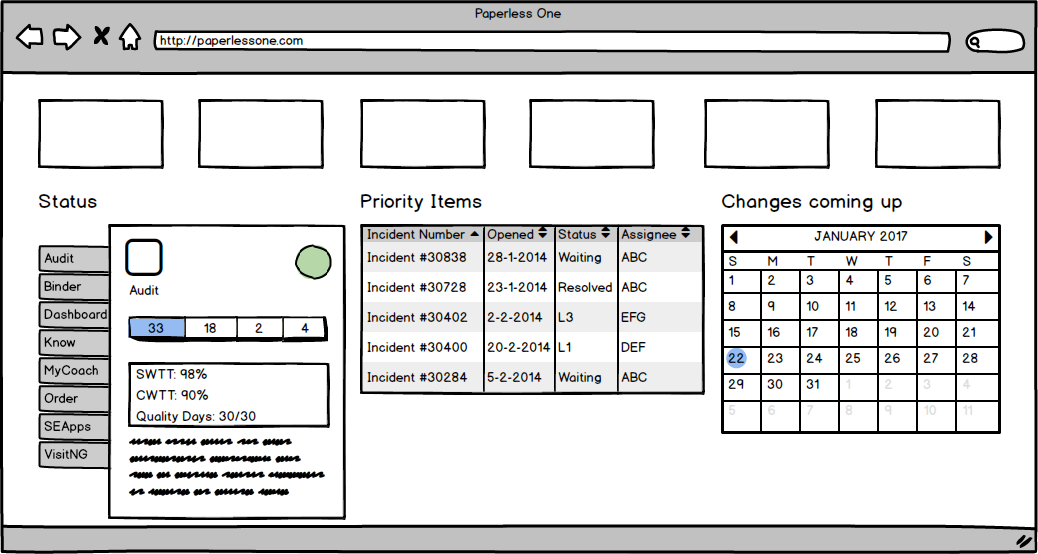
Planning pages
Wireframing
System architecture planning
Final product
After several iterations and consulting with my team members (who would be primary users of the system), we had the application ready! As a process, it led to enormous amount of learning as a ethnography and participatory design exercise.
Login page
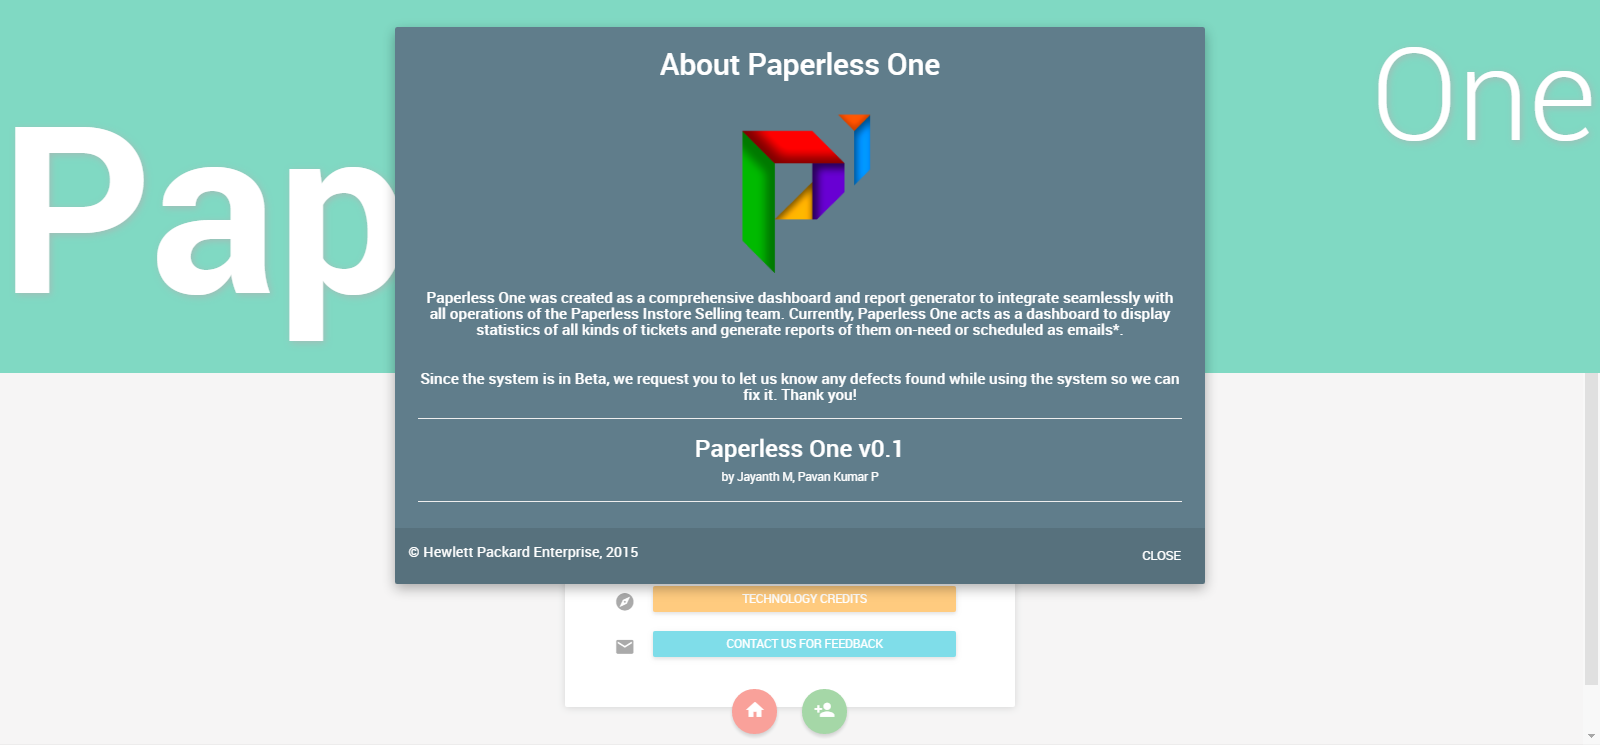
About page
Main page
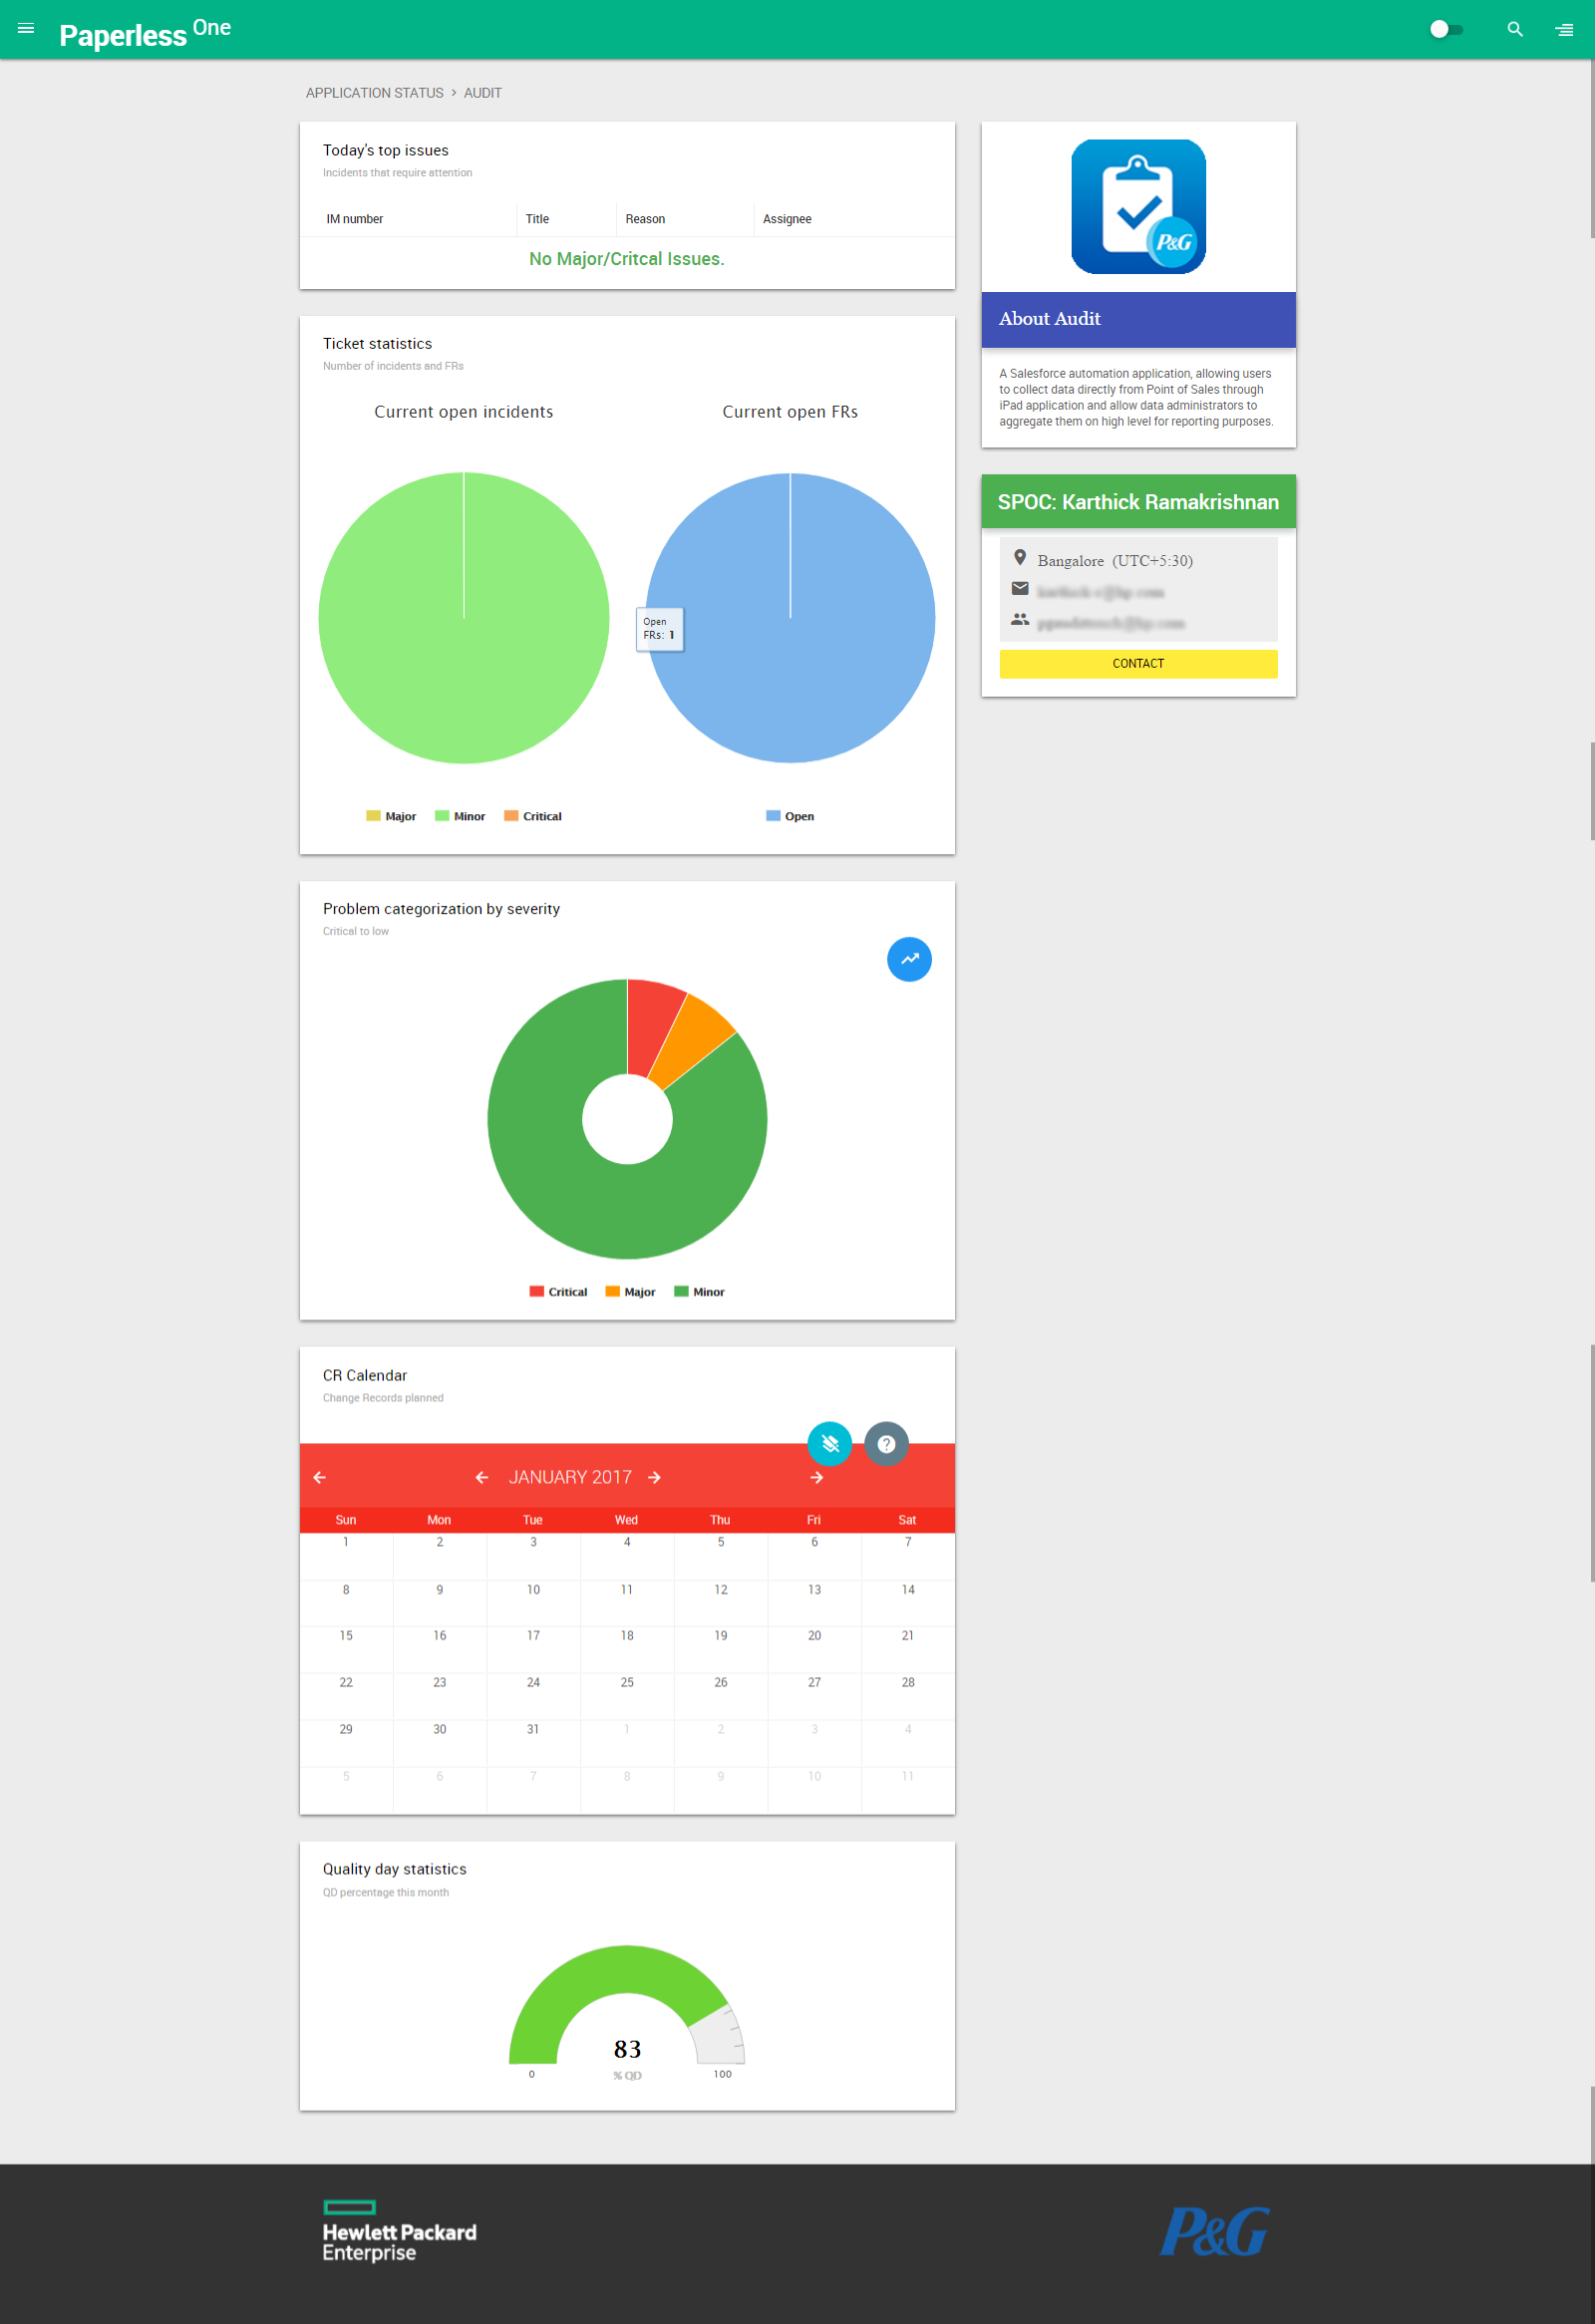
Application details
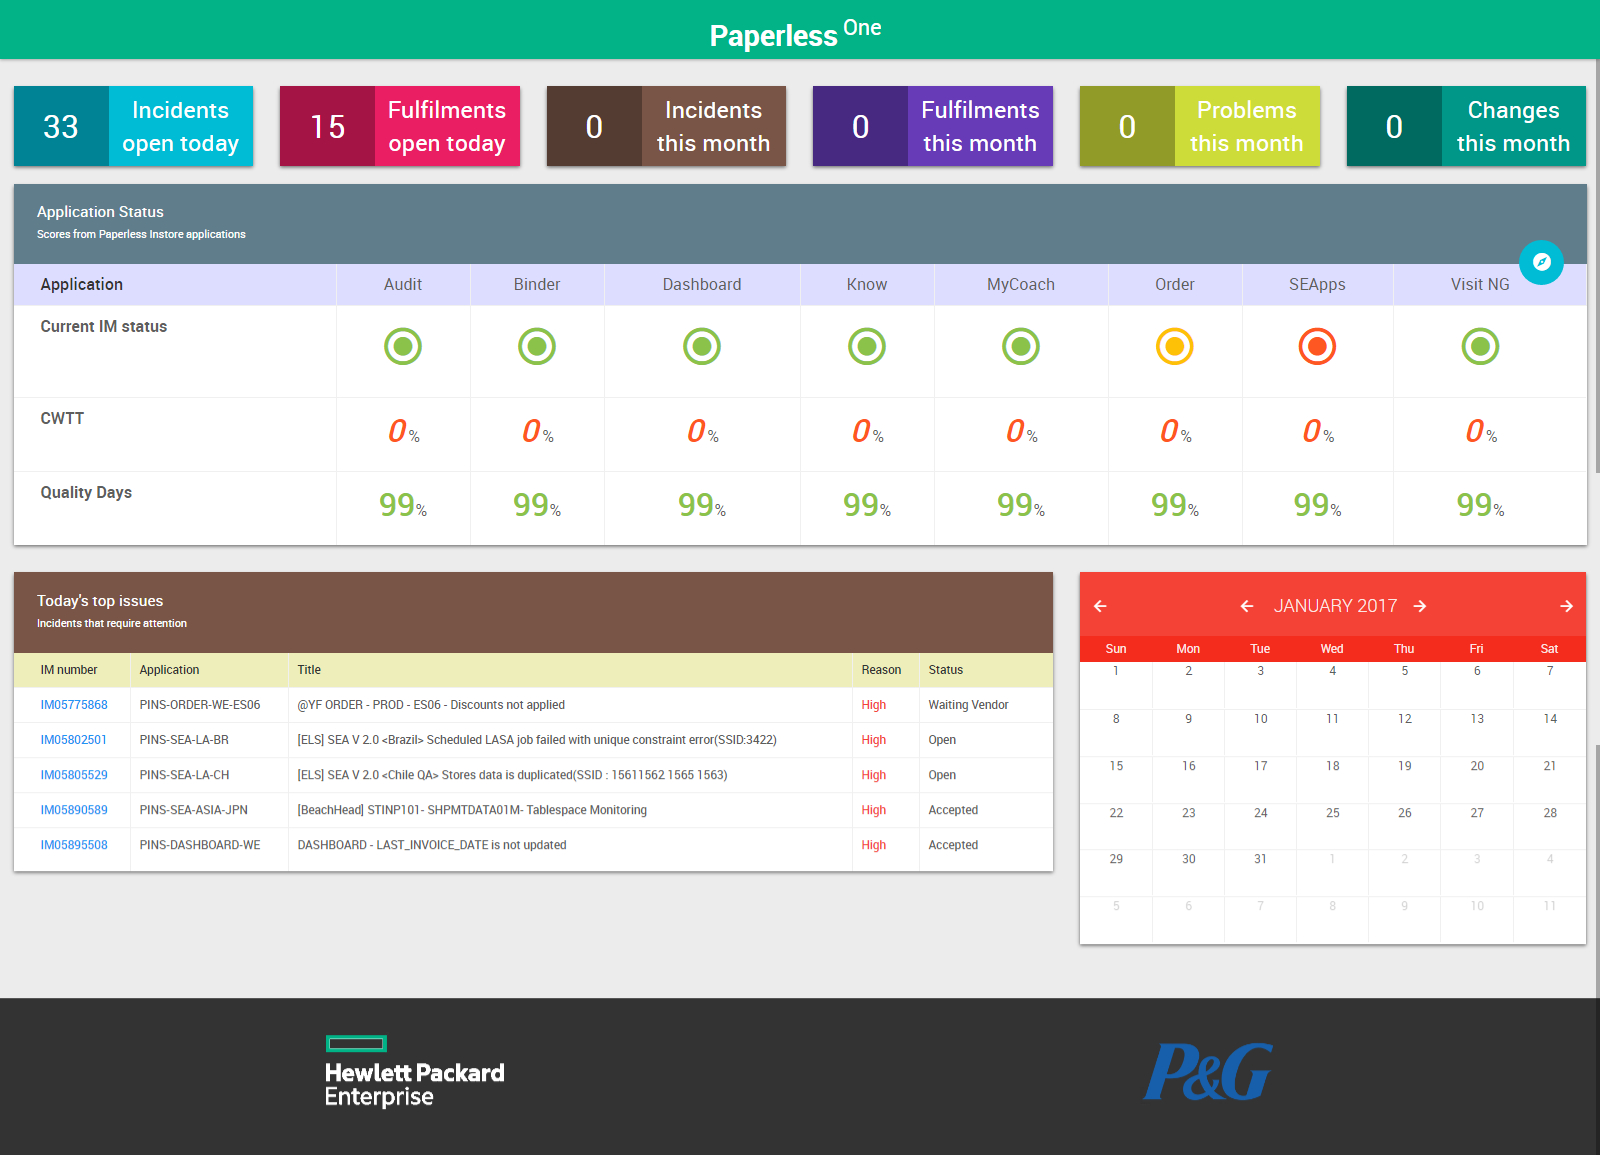
Single-pane-of-glass dashboard
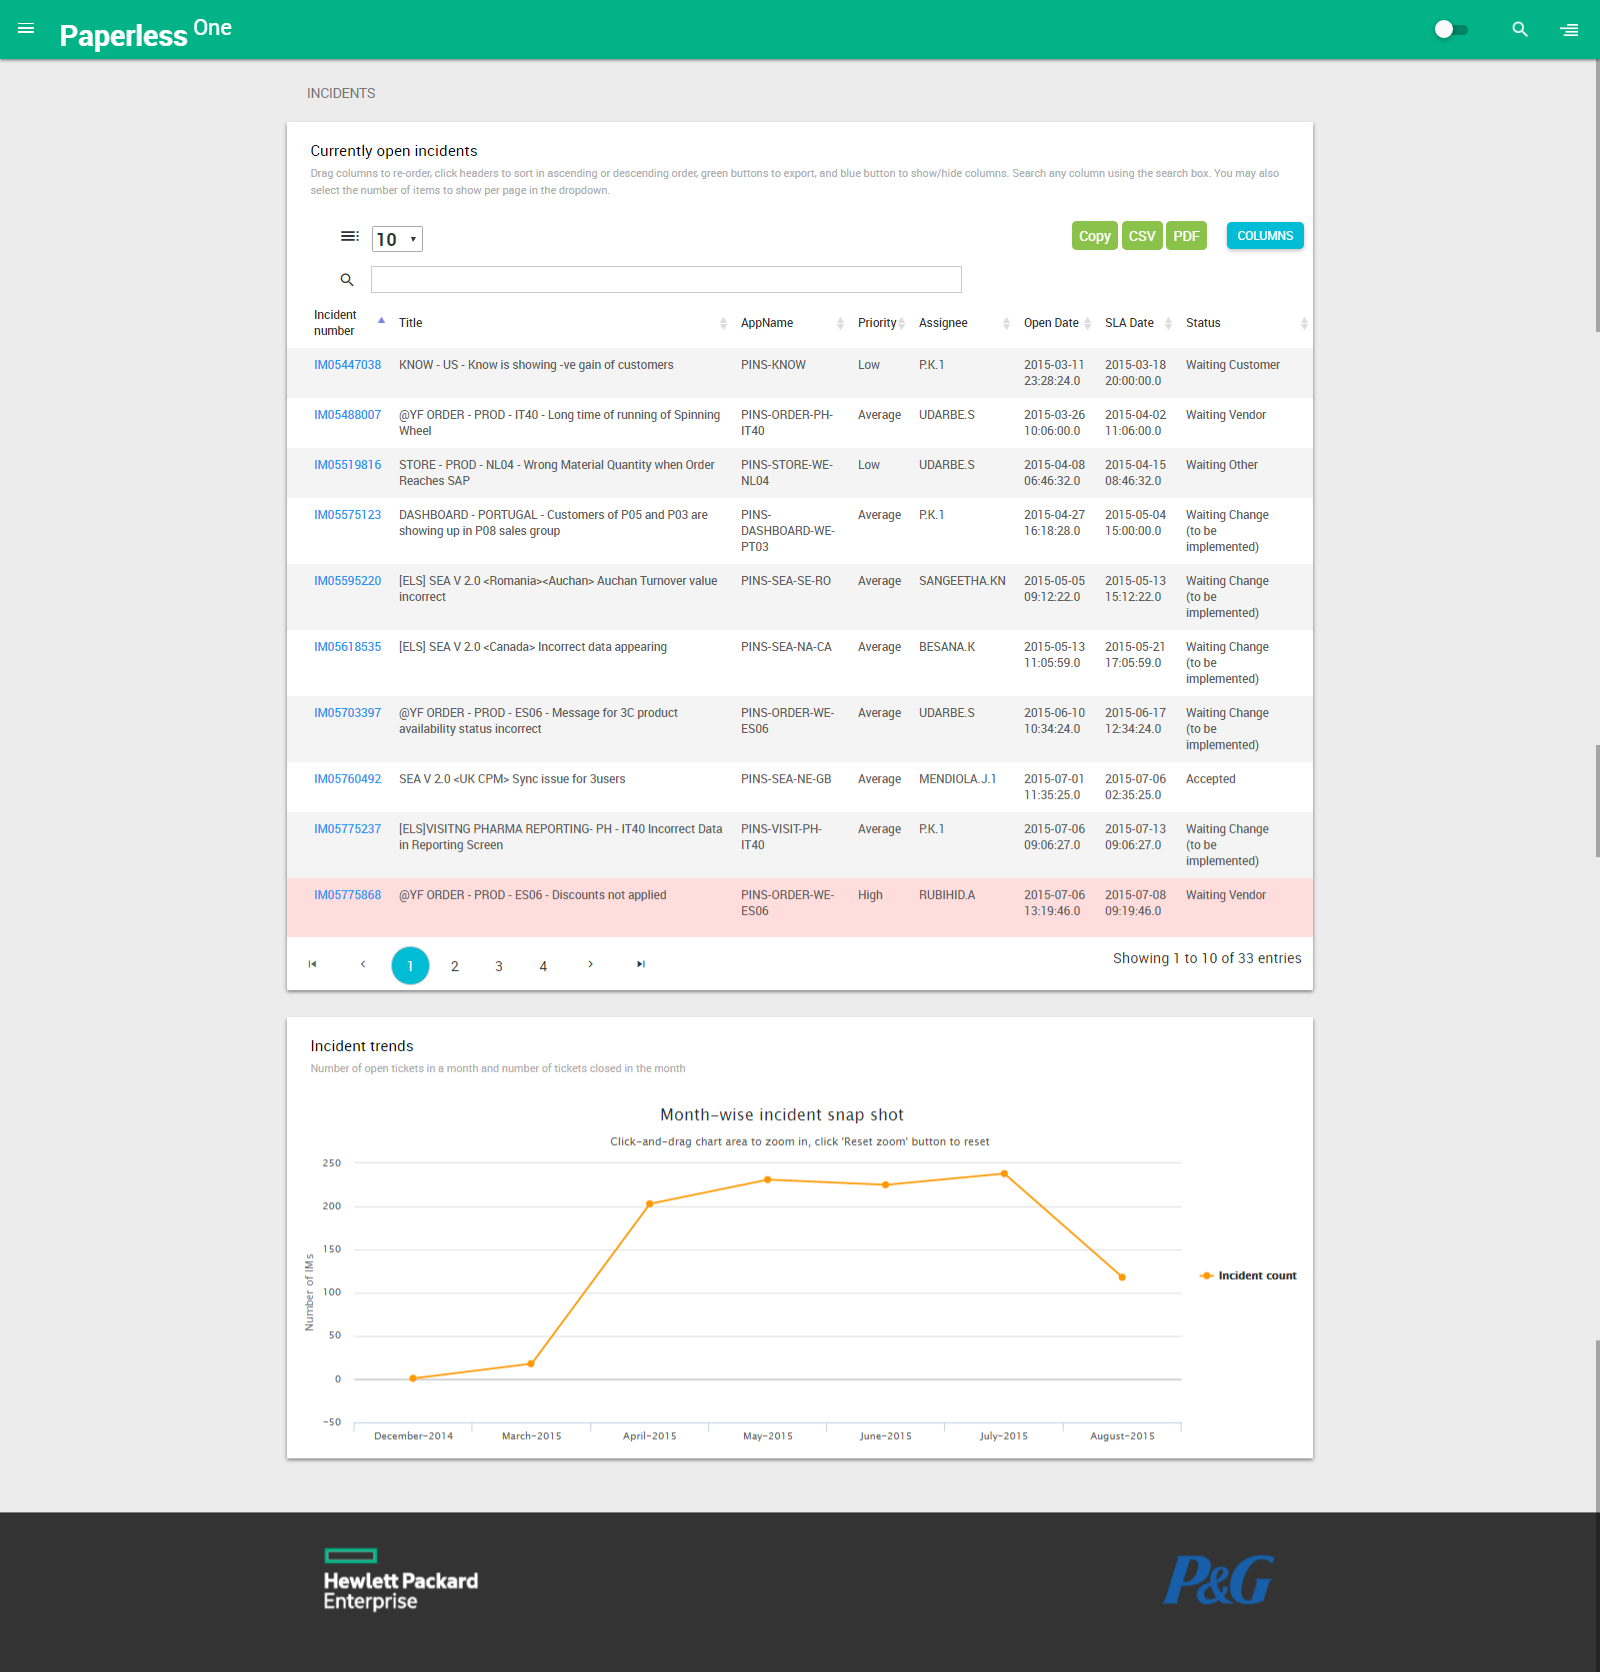
Incidents
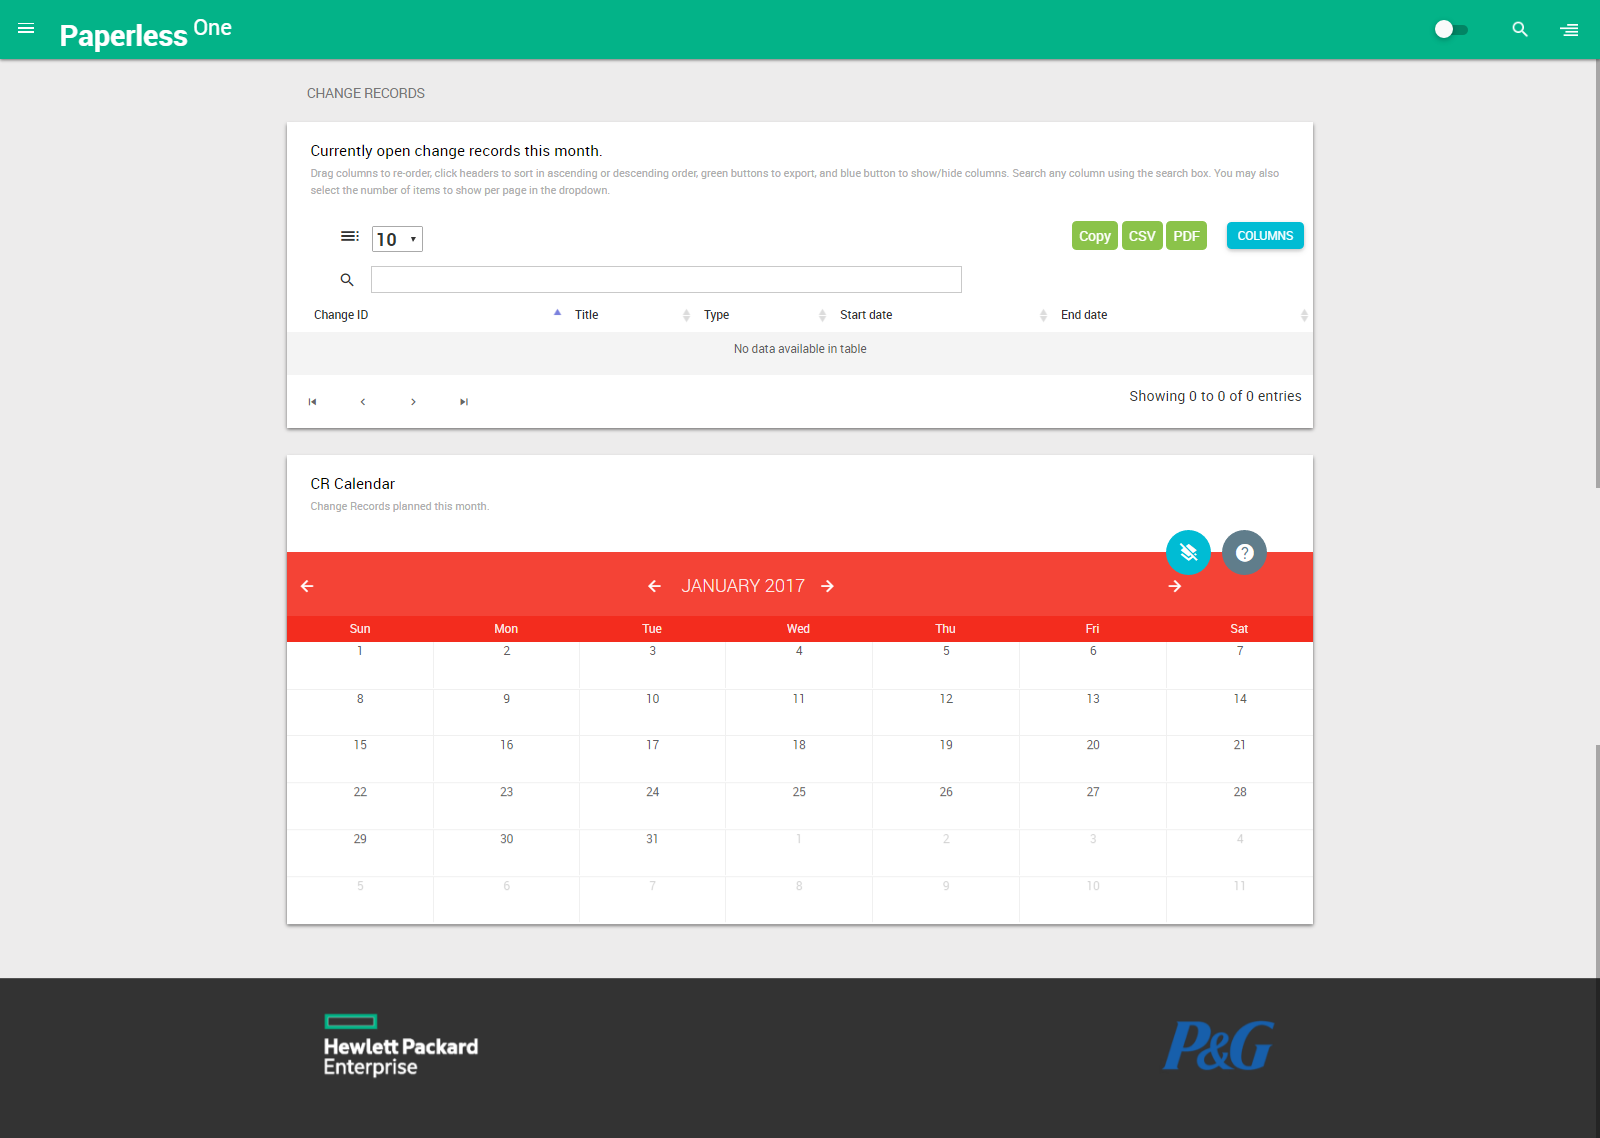
Changes
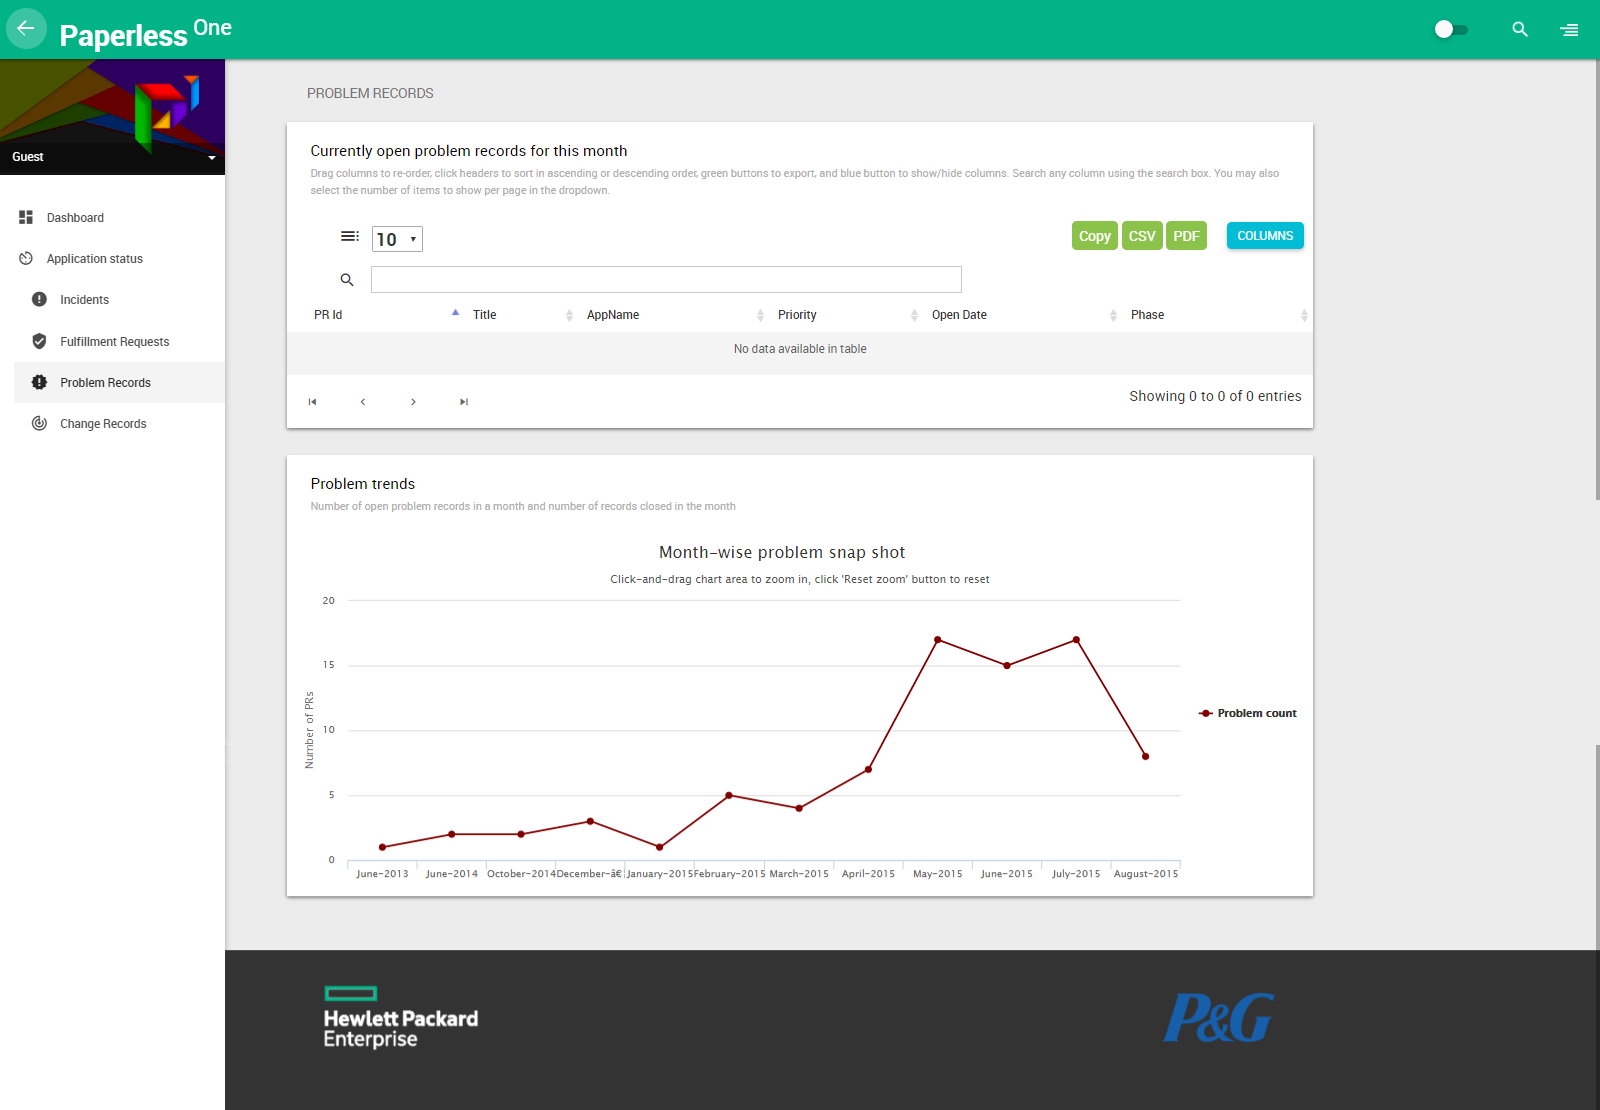
Problems page
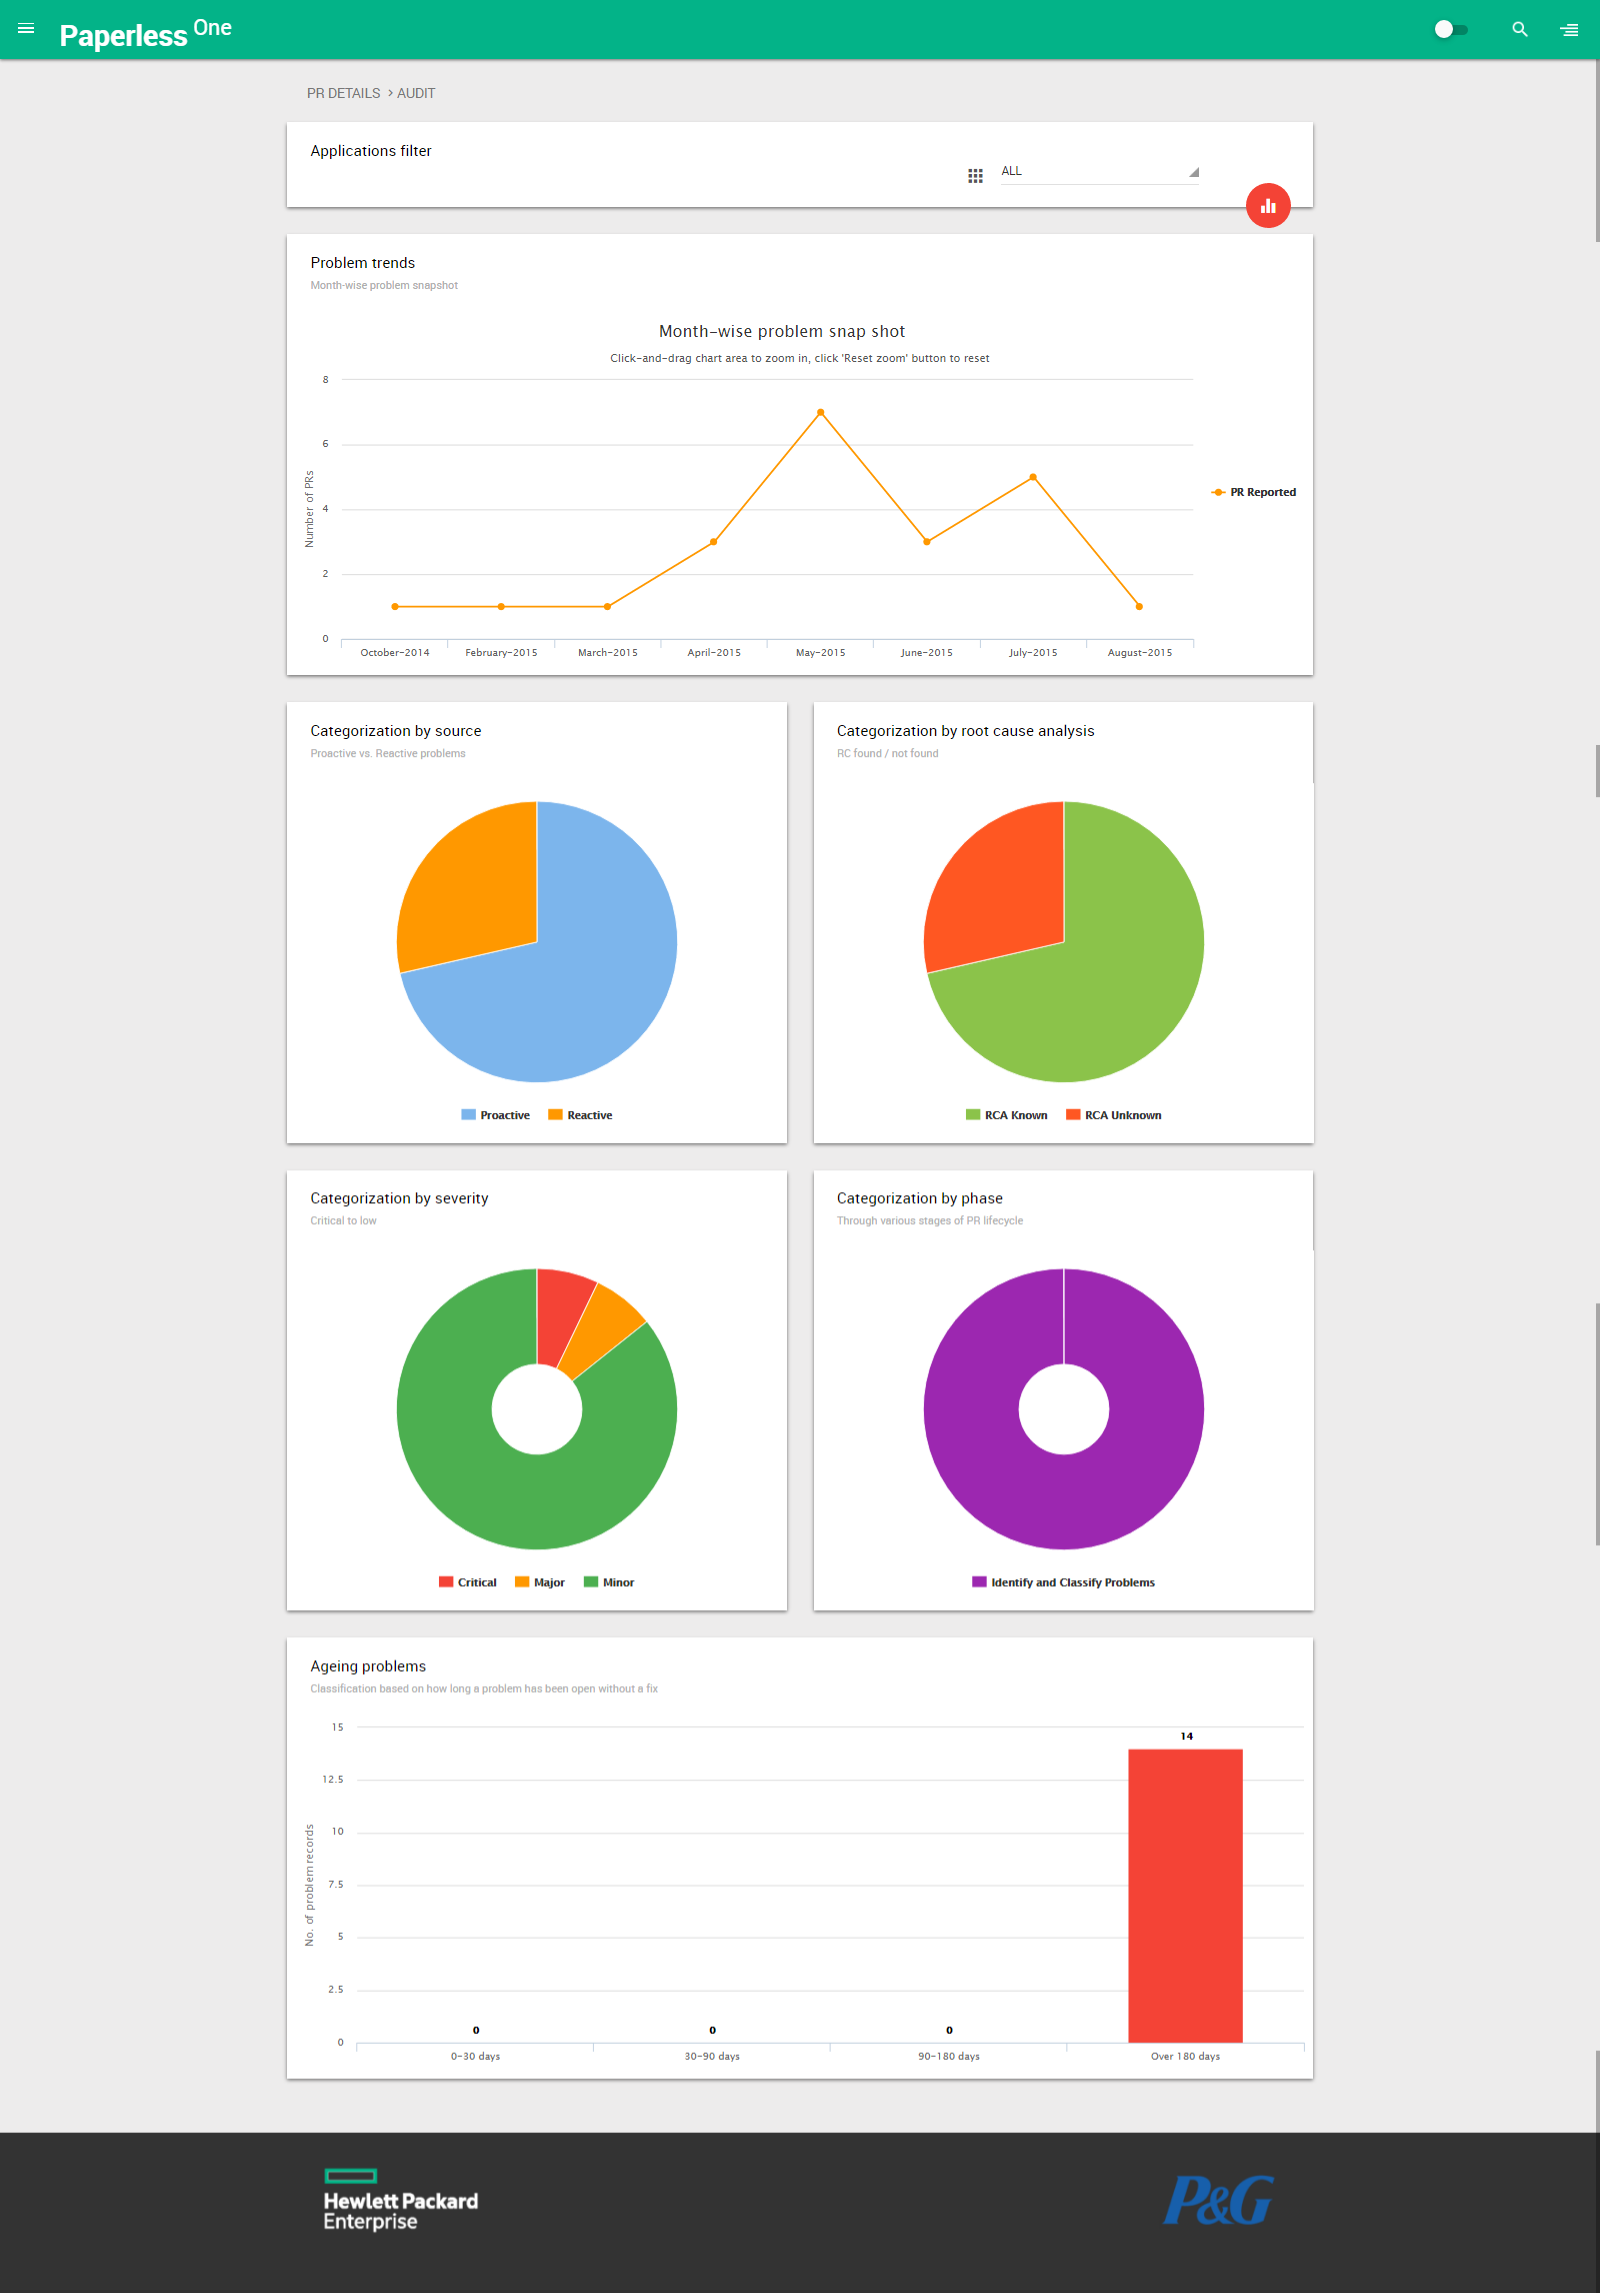
Problem classifications
Other features
Apart from the features we carried over from the previous dashboards, we added more features to make the tool a go-to application for everyday work.
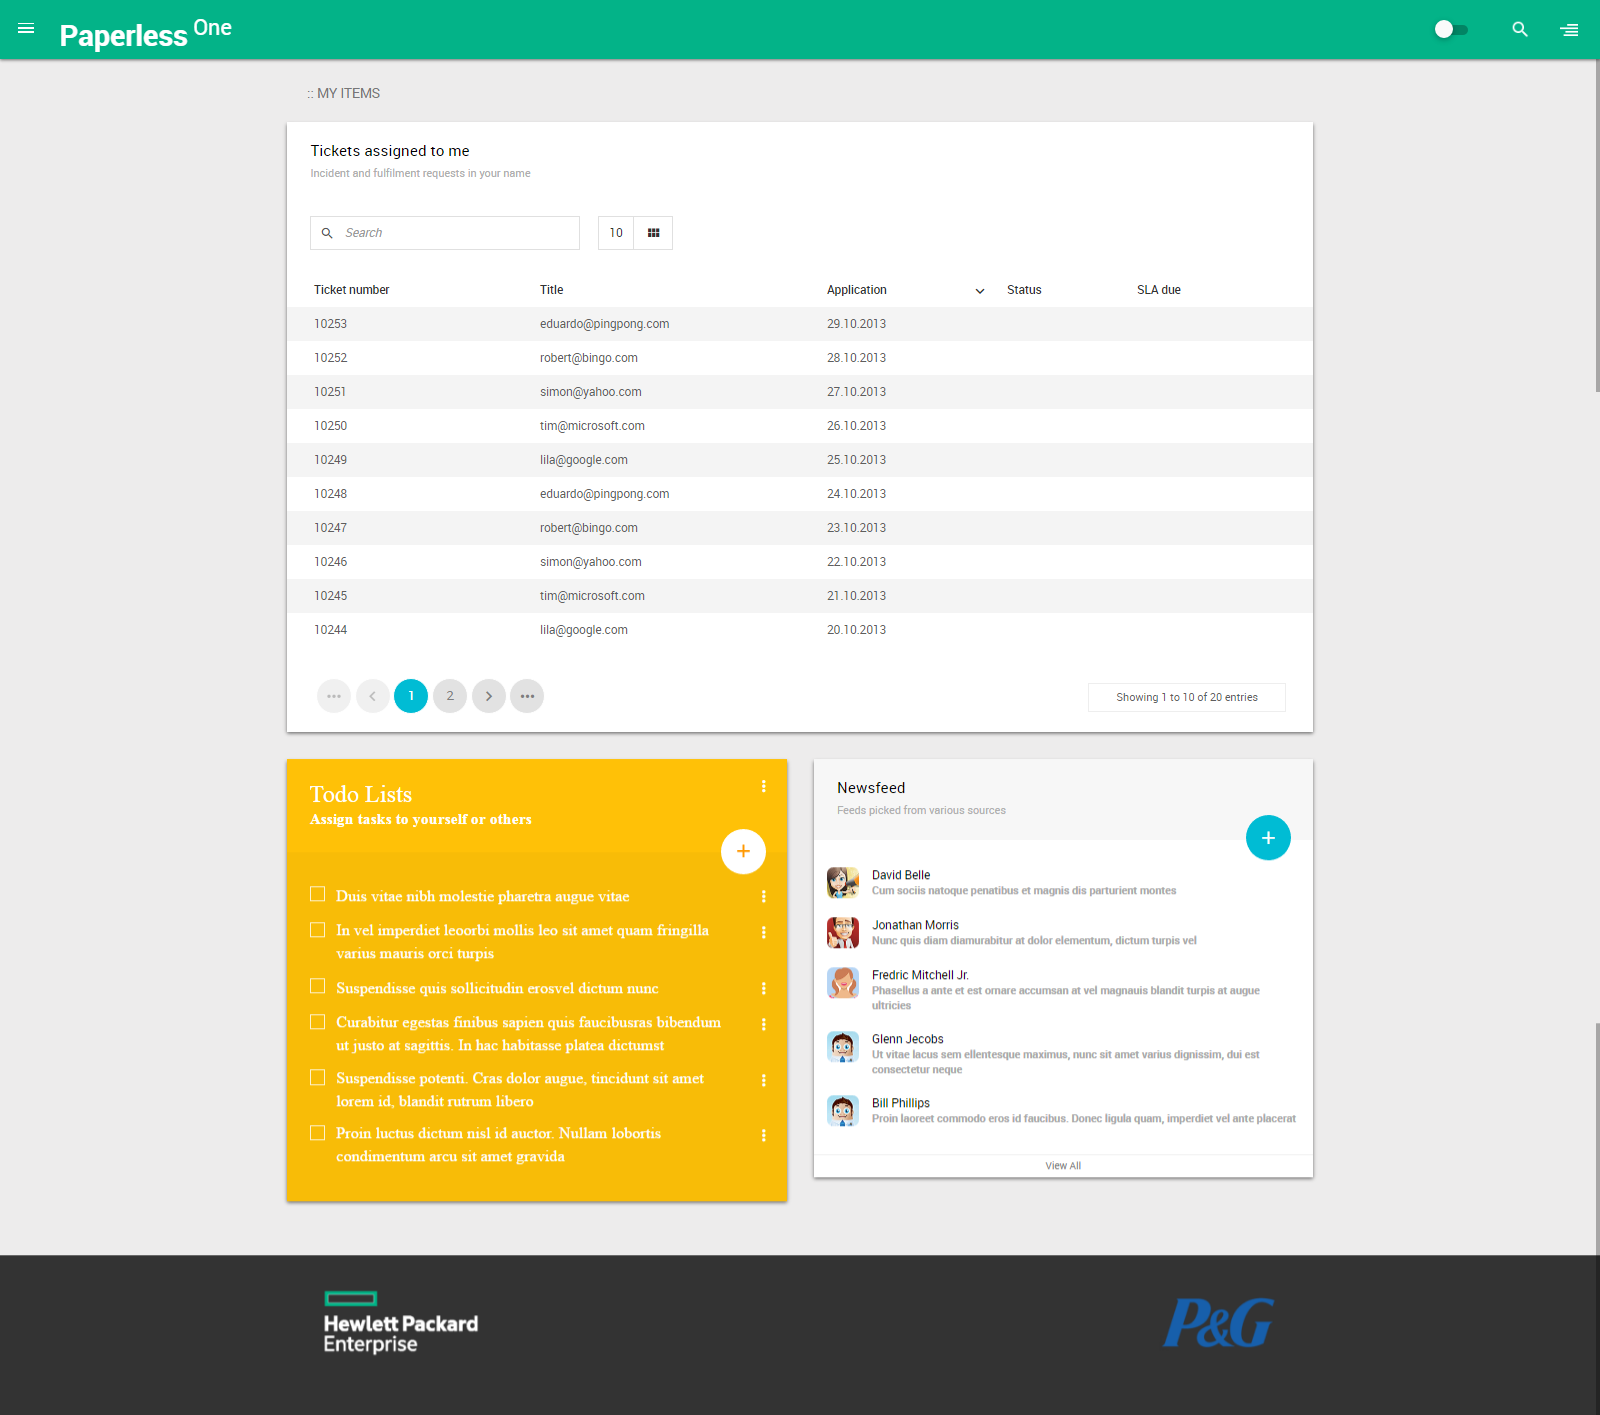
Task and ticket assignment
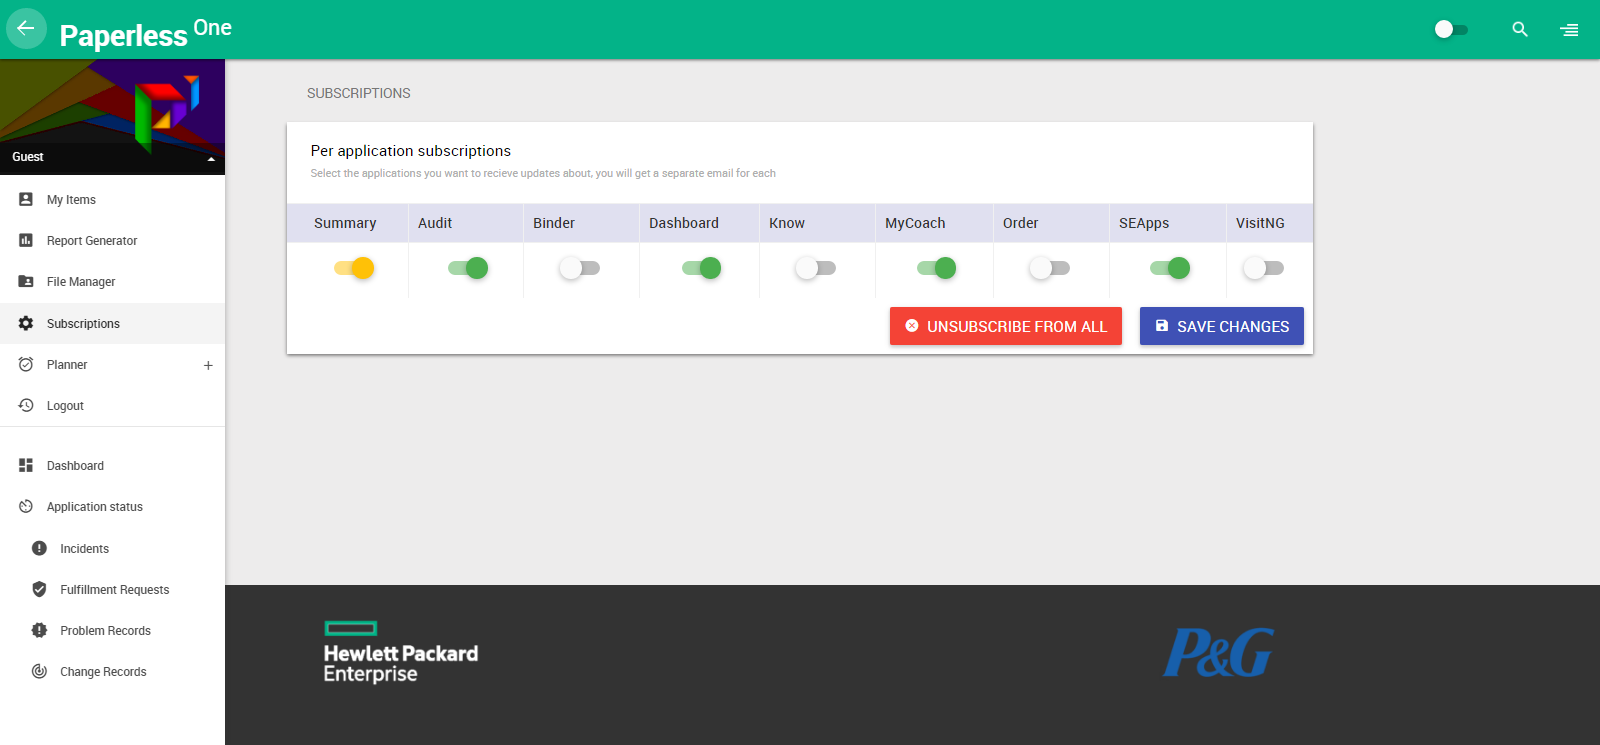
Subscriptions for alerts
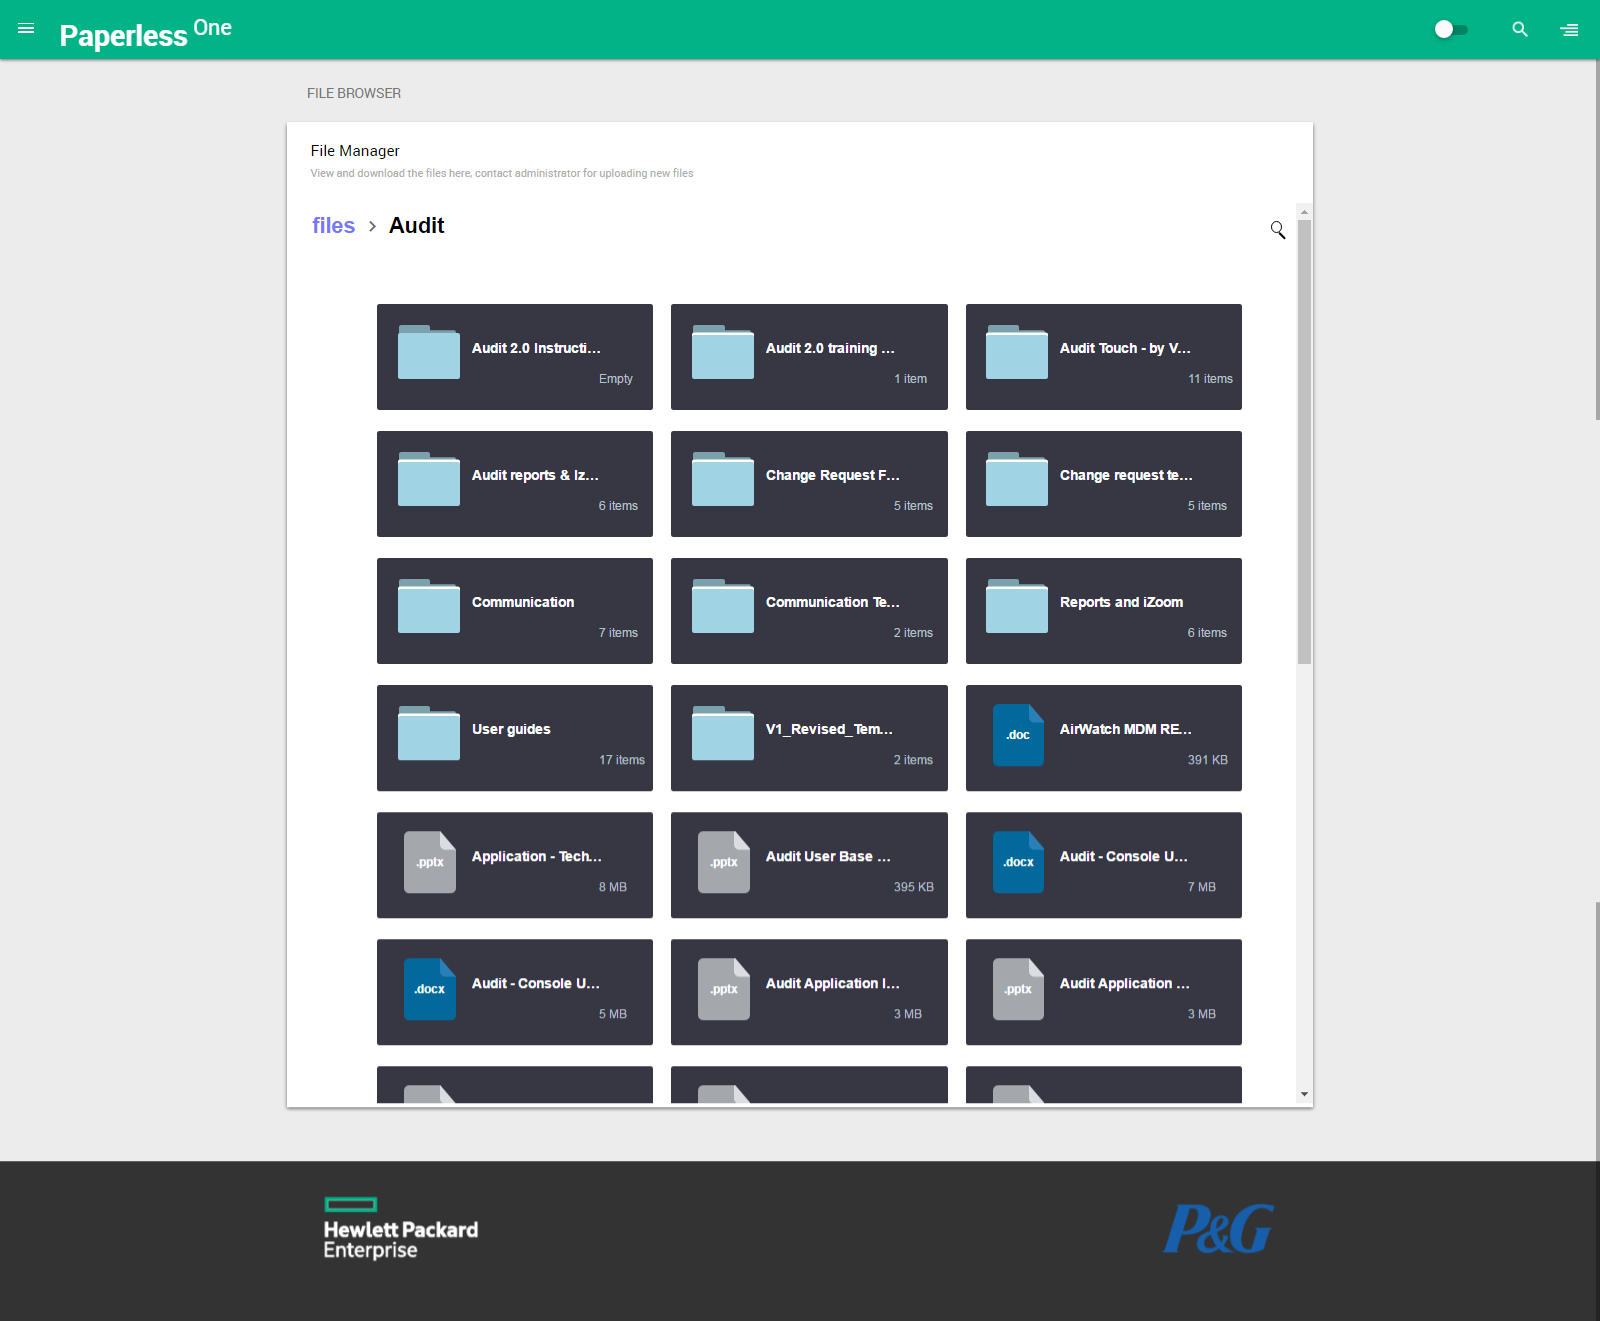
Built-in file manager
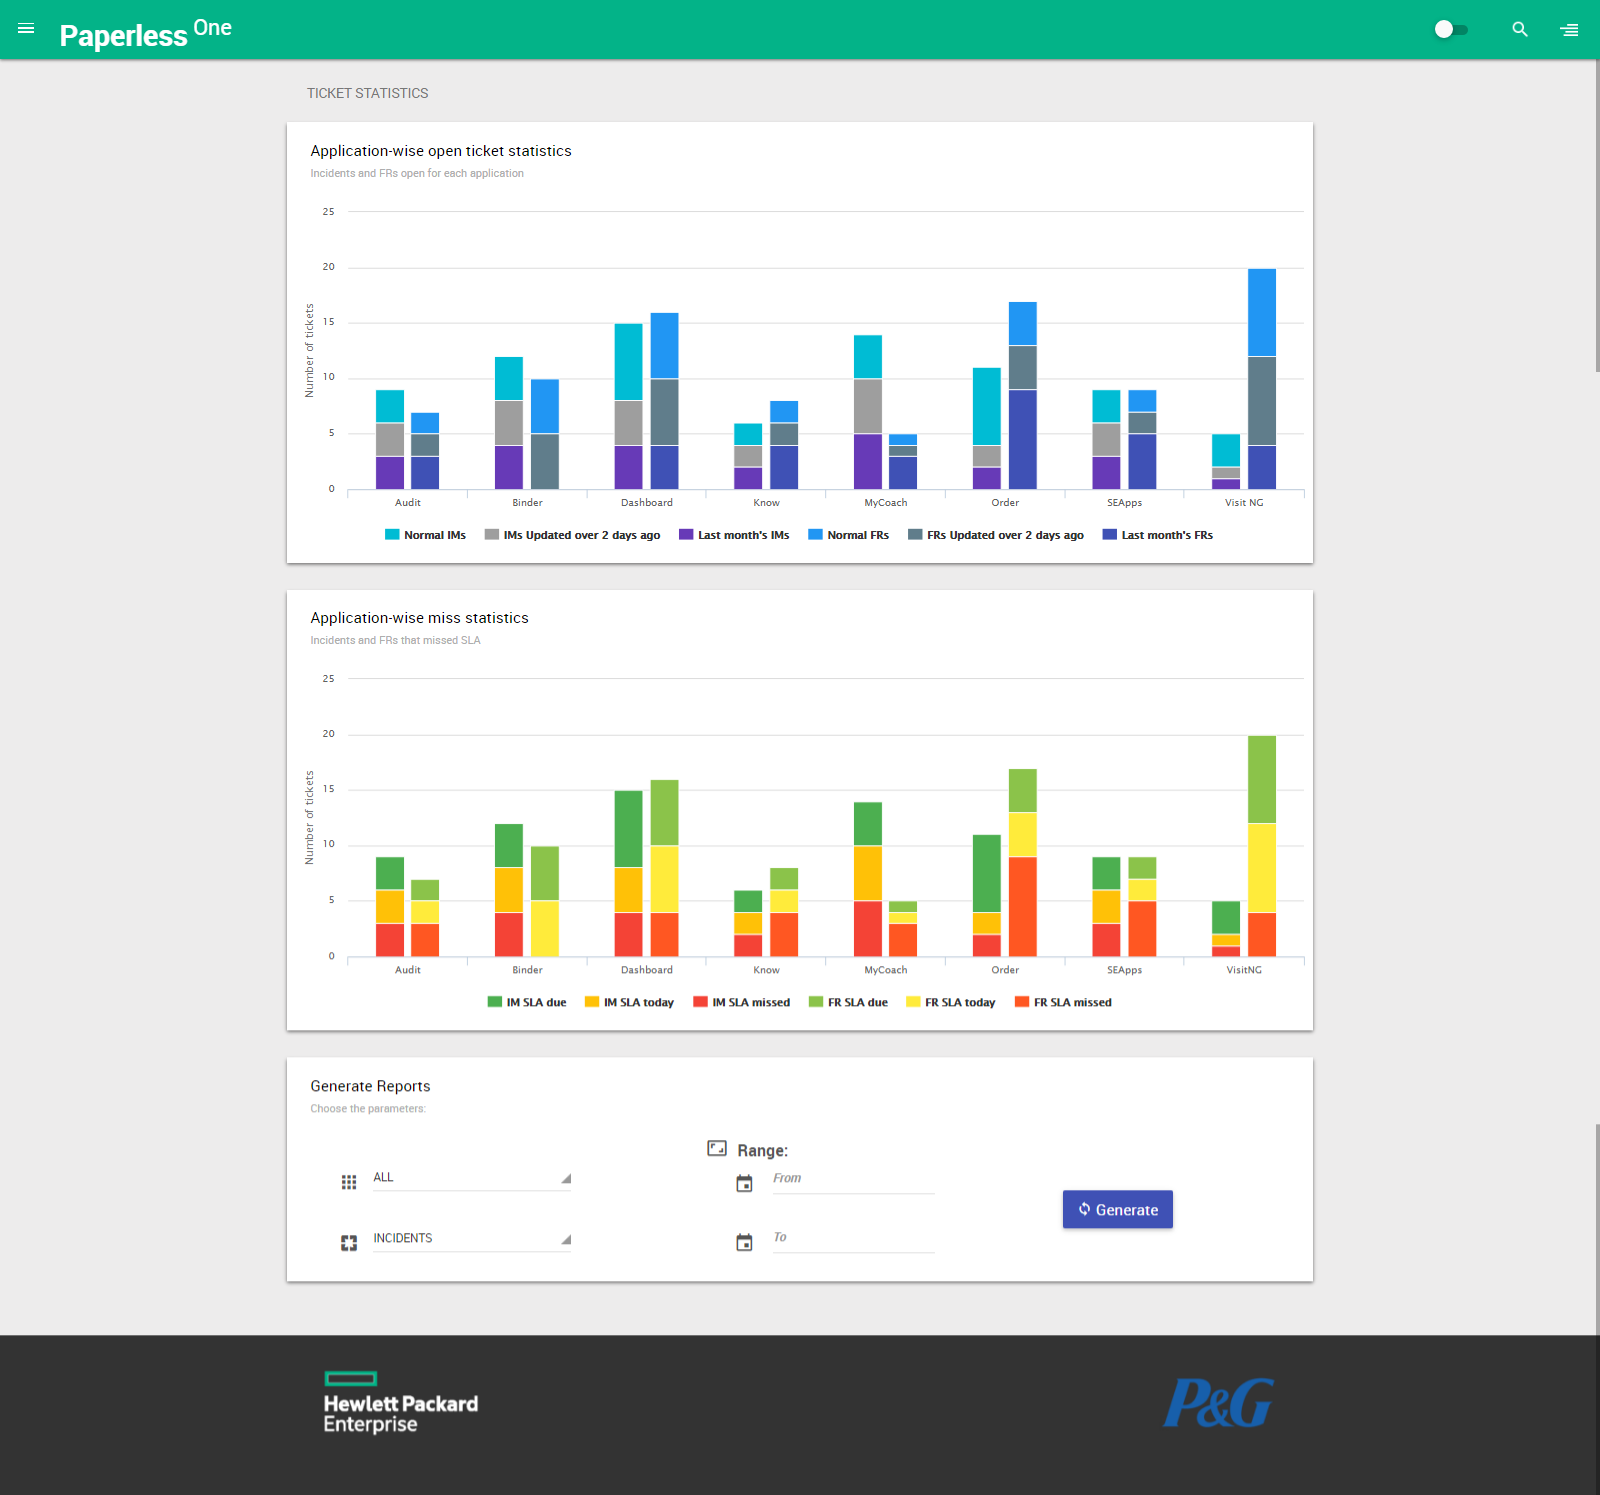
Report Generator
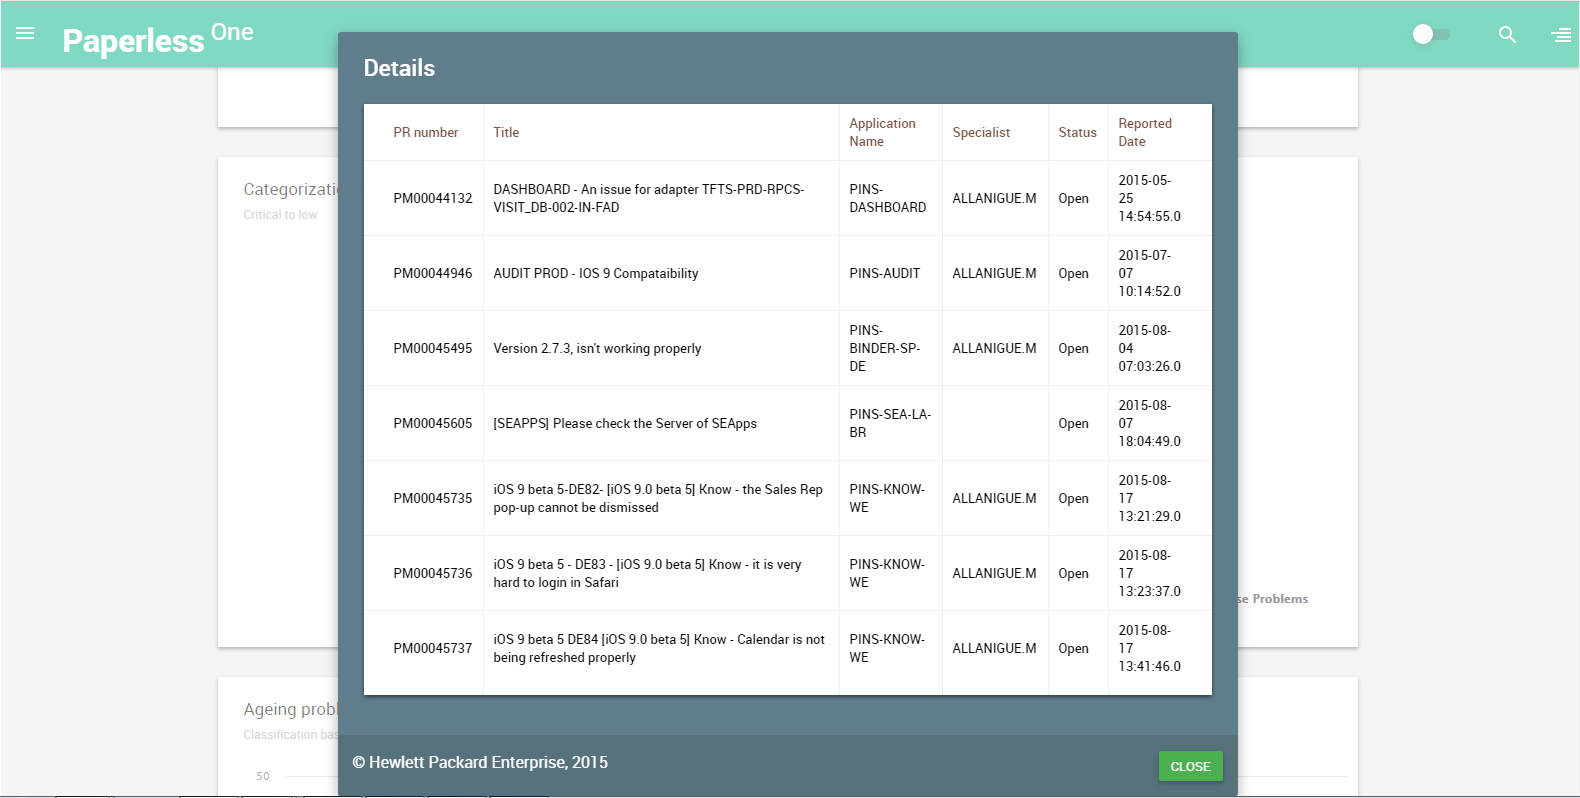
Graph detail drilldown popup
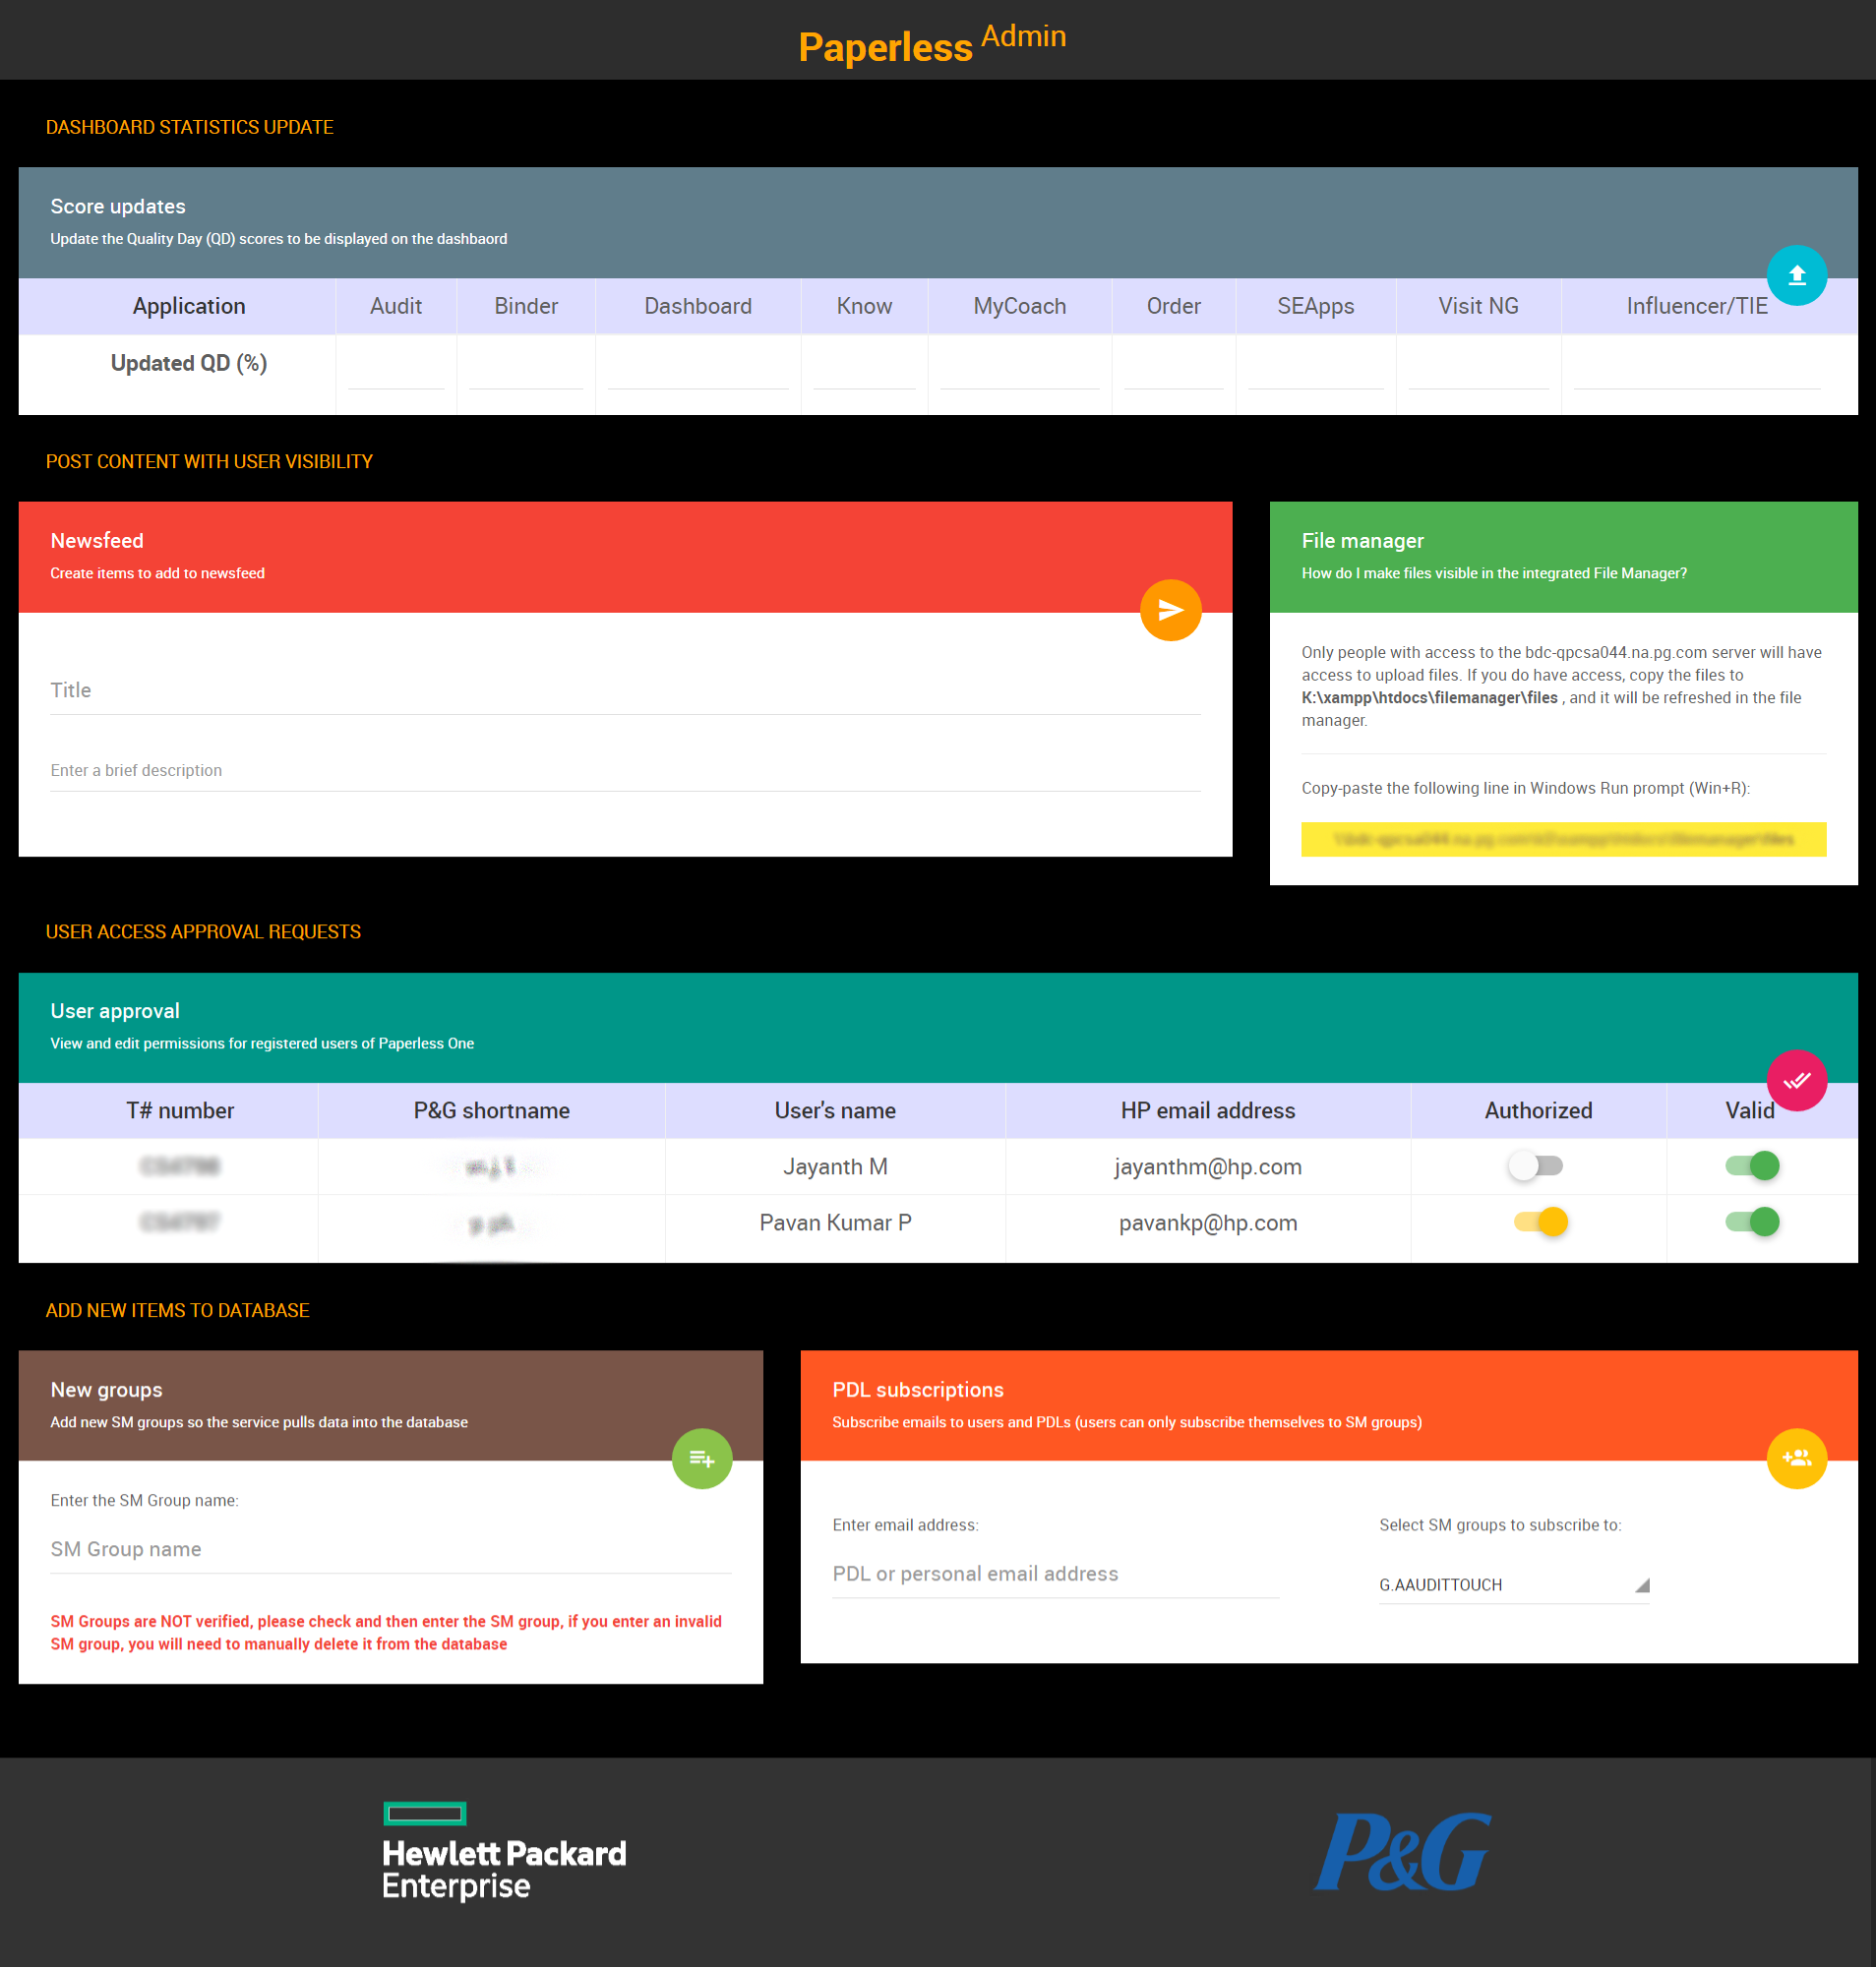
Admin console
Results
This tool was one of our best learning experiences in terms of HCI and agile software engineering, taking under two months from conceptualization to end result. It continues to be one of the most used tools in the team till now, helping avoid missed deadlines, save thousands of dollars in human effort and automate the routine tasks like never before.

 Jayanth
 Pavan
Pavan