How do you tell a city where to improve biking infrastructure? How do you get data to back your claims up? How do you convince people to participate in the study to collect data? What concerns with privacy would people have? If we know the causes of stress riders undergo, and the kinds of riders, we can define a user group, collect data about environmental factors that causes stress (and not physiological data, because it is subjective), and use those to form hypotheses and test them out.
From Prof. Chris LeDantec's prior research, we categorized riders into Fearless, Concerned, Worried and Non-users, based on Level of Traffic Stress (LTS). Then, the factors we concentrated on were physical environment (e.g. road quality, geography, air quality, noise), the social environment (e.g. traffic conditions, proximity to objects), and the rider (e.g. rider position and interaction with the bike). This combination of Digital Media, Physical Computing and IoT resulted in a large number of 'sensor boxes' that were deployed on bikes in Atlanta to collect data.
Type Class project, collaborative Role Surface Quality Team sensor lead, Embedded system troubleshooting, Mechanical assembly, 3D modeling and printing, Server implementation Duration 5 months (Jan 2018 - May 2018) Tools Arduino, Raspberry Pi, Matrix, Sensors, Python Flask, Tableau, Autodesk Inventor, Dimension SST 3D printer Objectives System and Solution Architecture, Social Activism, Sensor interfacing, Embedded system networking, Sensemaking of contextual data, Ethics & Privacy
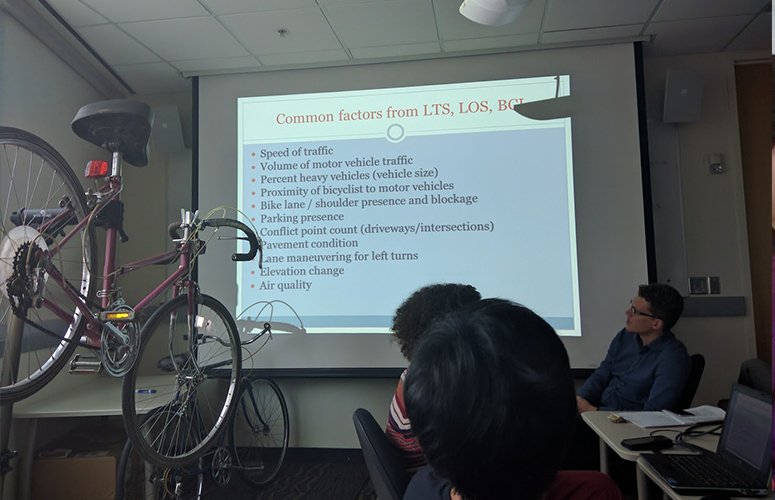
Deriving from Peter Furth's research on Traffic Stress, Professors Chris LeDantec and Kari Watkins - in their involvement with Cycle Atlanta - came up with a categorization for bike riders.
They categorized bike riders into:
We ignored the first and the last categories, and decided to measure what concerns them about riding bikes under what conditions.
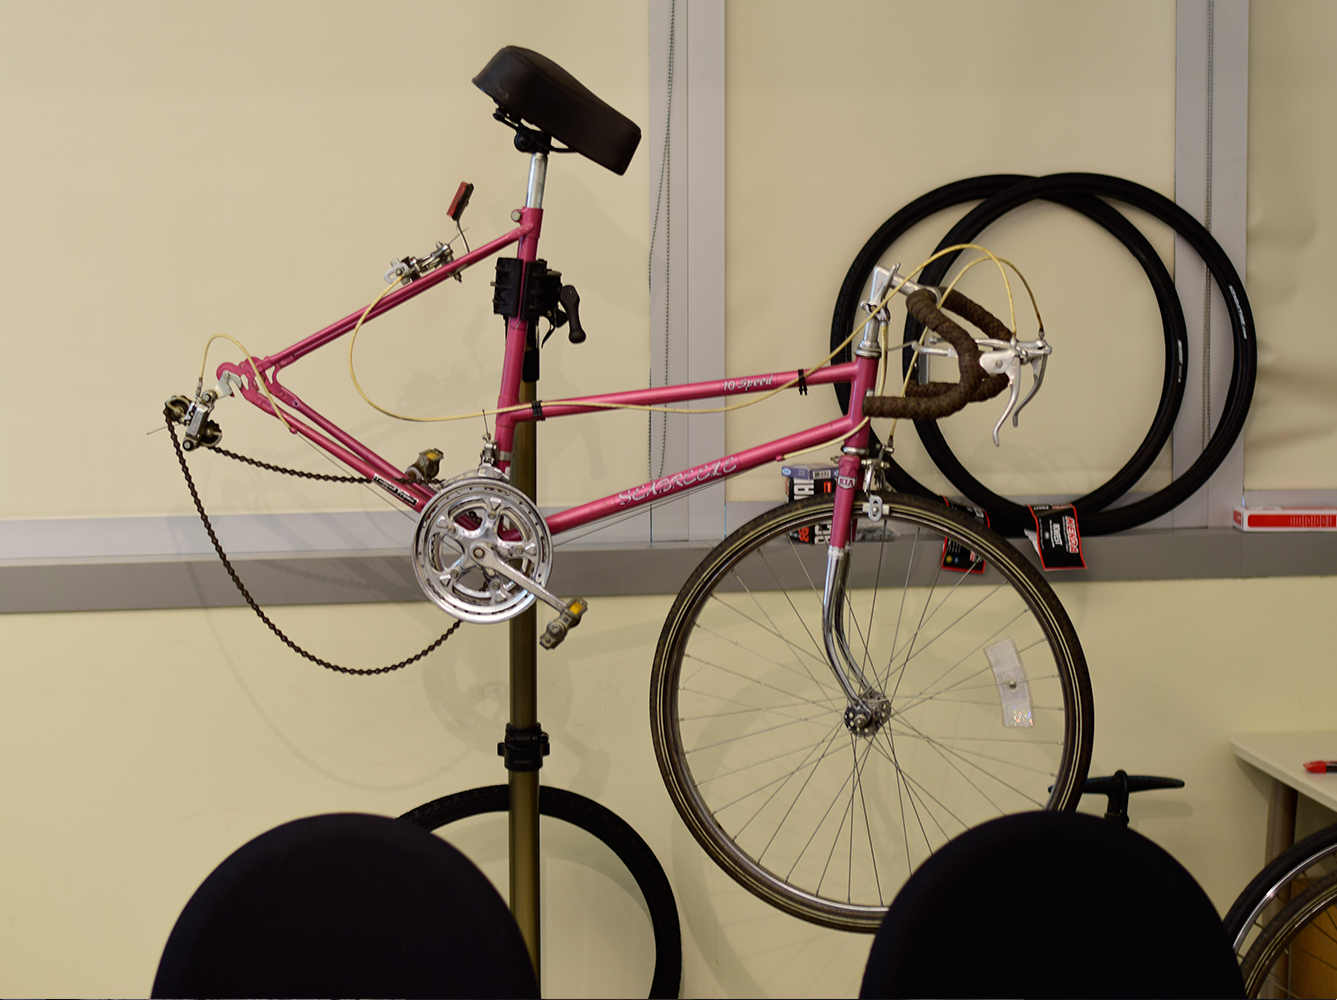
Not much to explain here, apart from we had to read a book about bike repair, take one apart and put it back, just in case we break / have to take apart something while integrating sensors into the bike.
We did have some ideas about embedded sensors in the bike frame, but because we needed a platform that was easily distributed and installed on bikes, we decided not to have any that required taking your bike apart.
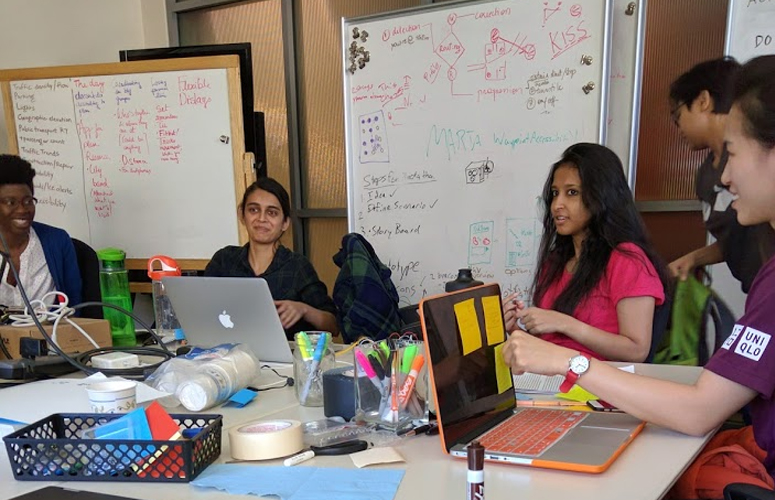
The studio class alternated between readings/discussion and building. Reading our assigned research papers and articles, synthesizing it and discussing it in class gave us many things from implementation ideas to a deeper understanding of ethical implications and driving public policies in the domain.
A list of readings can be found in the 'Course Schedule' section on the course website.
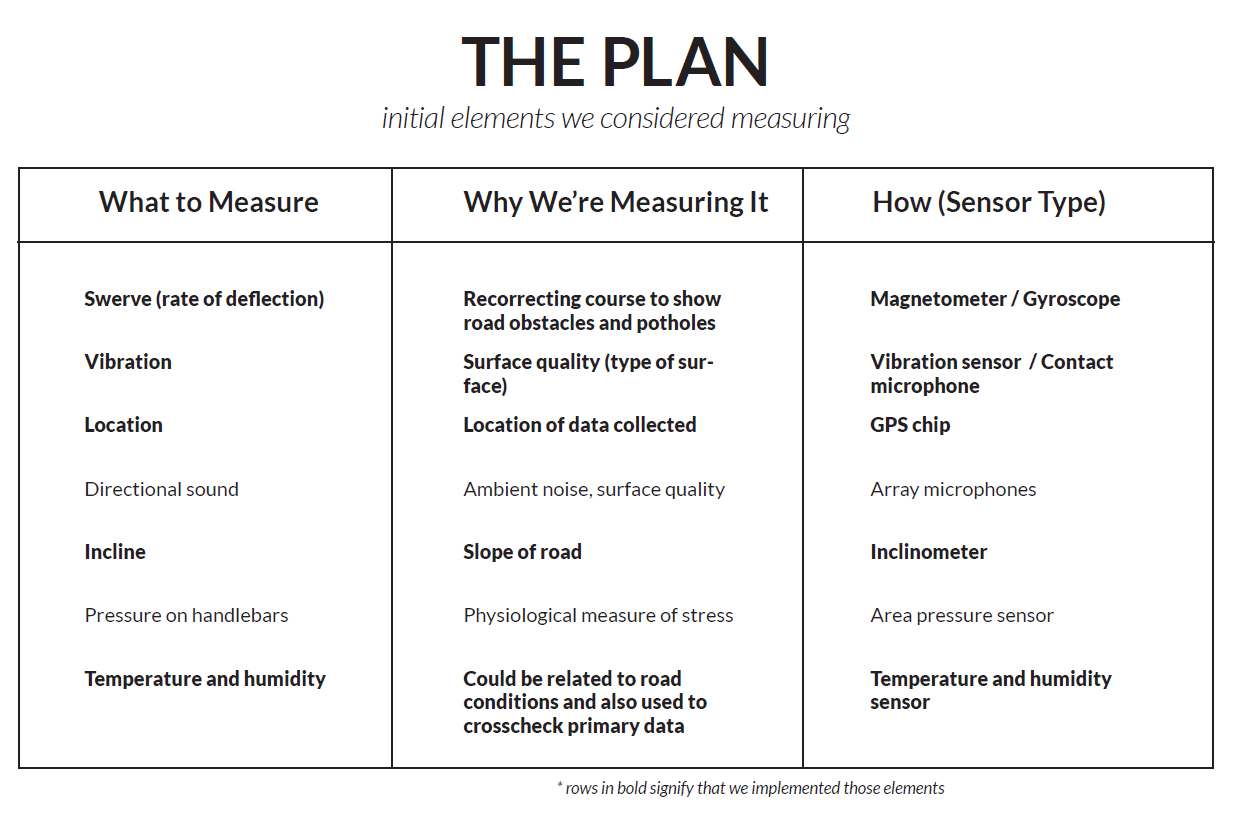
Our team was working on surface quality and environmental factors, while the other teams took up proximity and air quality respectively. With some planning and the sensors that were available to us, we decided to collect the following data.
A list of readings can be found in the 'Course Schedule' section on the course website.
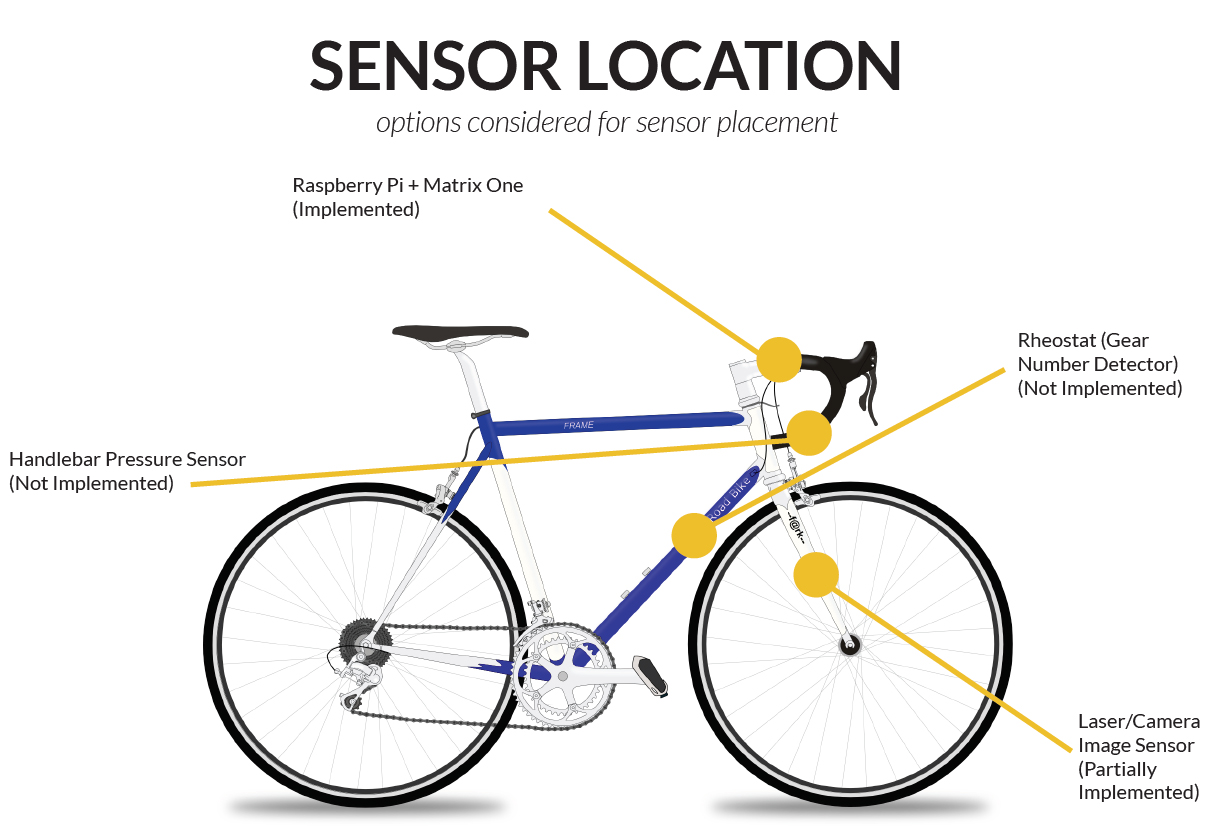
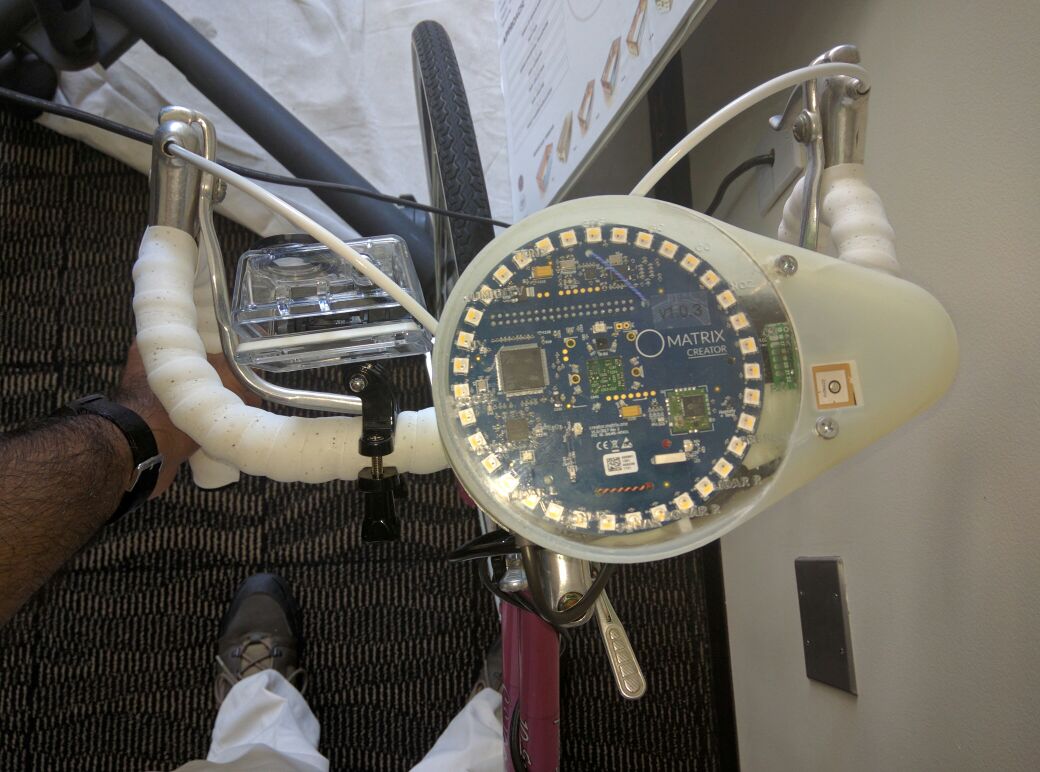
After some research into different sensors, we decided that it would be best to have sensors in one location. Because swerves, turns, bumps and so on were important to us, we decided to put the box of sensors on the handlebar.
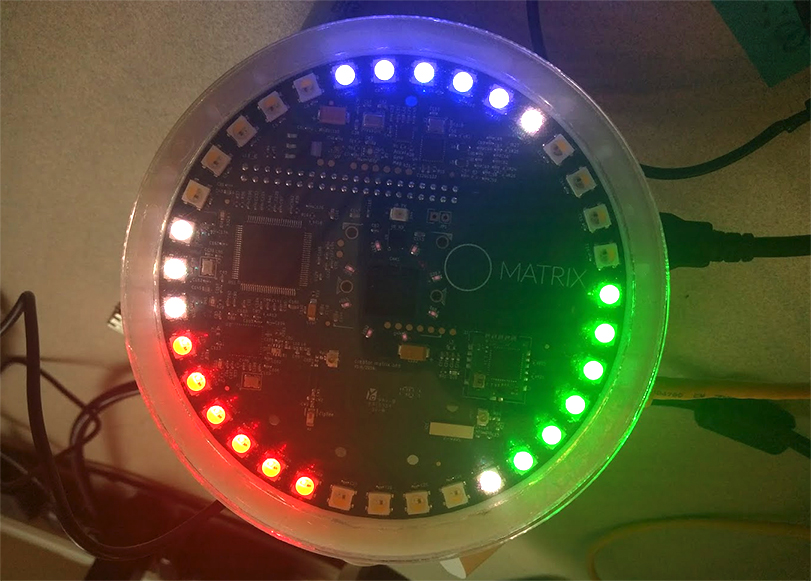
We found this IoT platform called Matrix One that had just launched. It promised several sensors, and interfaced with a Raspberry Pi. Since our plan from the beginning was to use a Raspberry Pi for brains anyway, we figured we would give it a go.

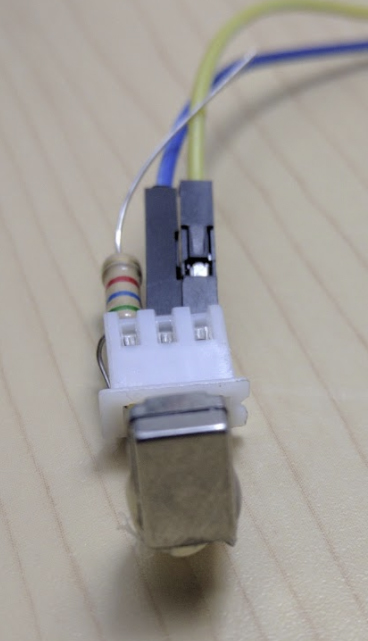
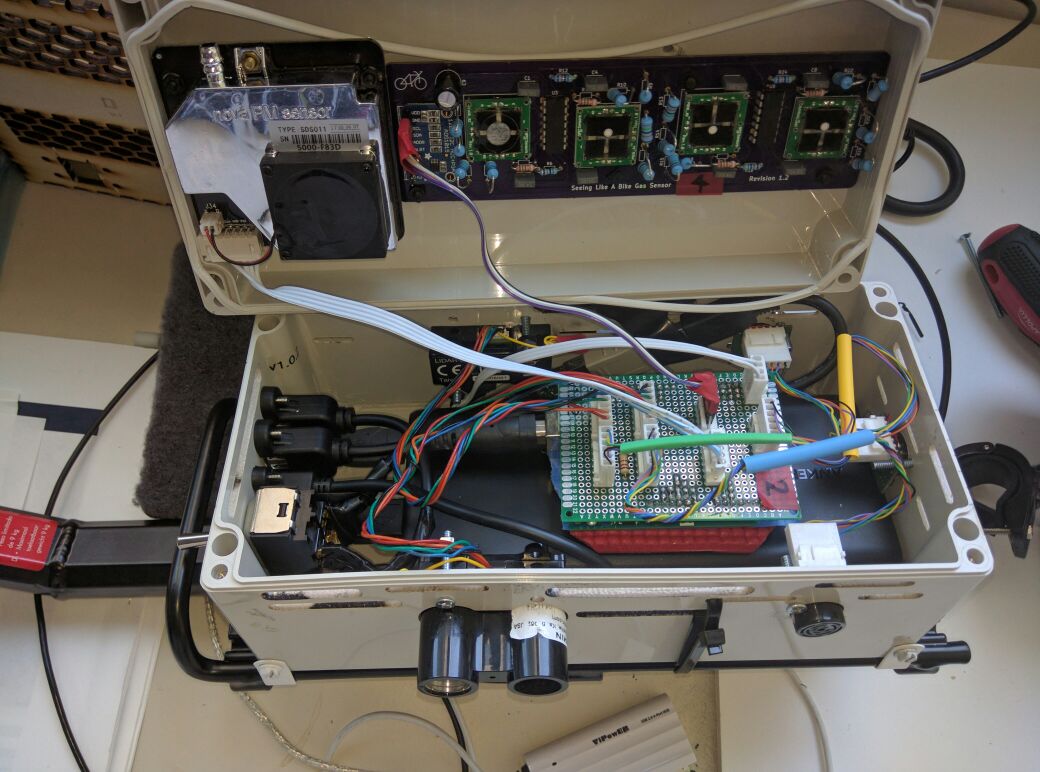
We also added a few more sensors, like the GPS receiver and contact microphone (an accelerometer in disguise) for things that the Matrix One could not do.
On the Matrix One itself, we got data from the IMU (accelerometer, gyroscope, magnetometer), the light sensor and ultraviolet sensor, the directional microphones, temperature and humidity. We figured we'd collect all this data so, in future, we could pinpoint certain factors and eliminate them from certain measures (for example, riding on a warm sunny day does not cause as much stress as driving on a snowy day).
Finally, we correlated certain data points to measures in swerve, bumps, etc., just as a label for future data analysis. Below is a sample of the data we collected from a short drive around campus. Finally, there is also a sample of GPS data we collected (normalized) for our drive around campus.


The readings from IMU were not very intuitive for someone who had not processed that kind of data, so we thought we could come up with our own system using computer vision that could better measure the surface quality. We got the PlayStation Eye and a focusable cross-hair laser, with the hopes of measuring deviation from standard smooth surface to measure the roughness of the road.
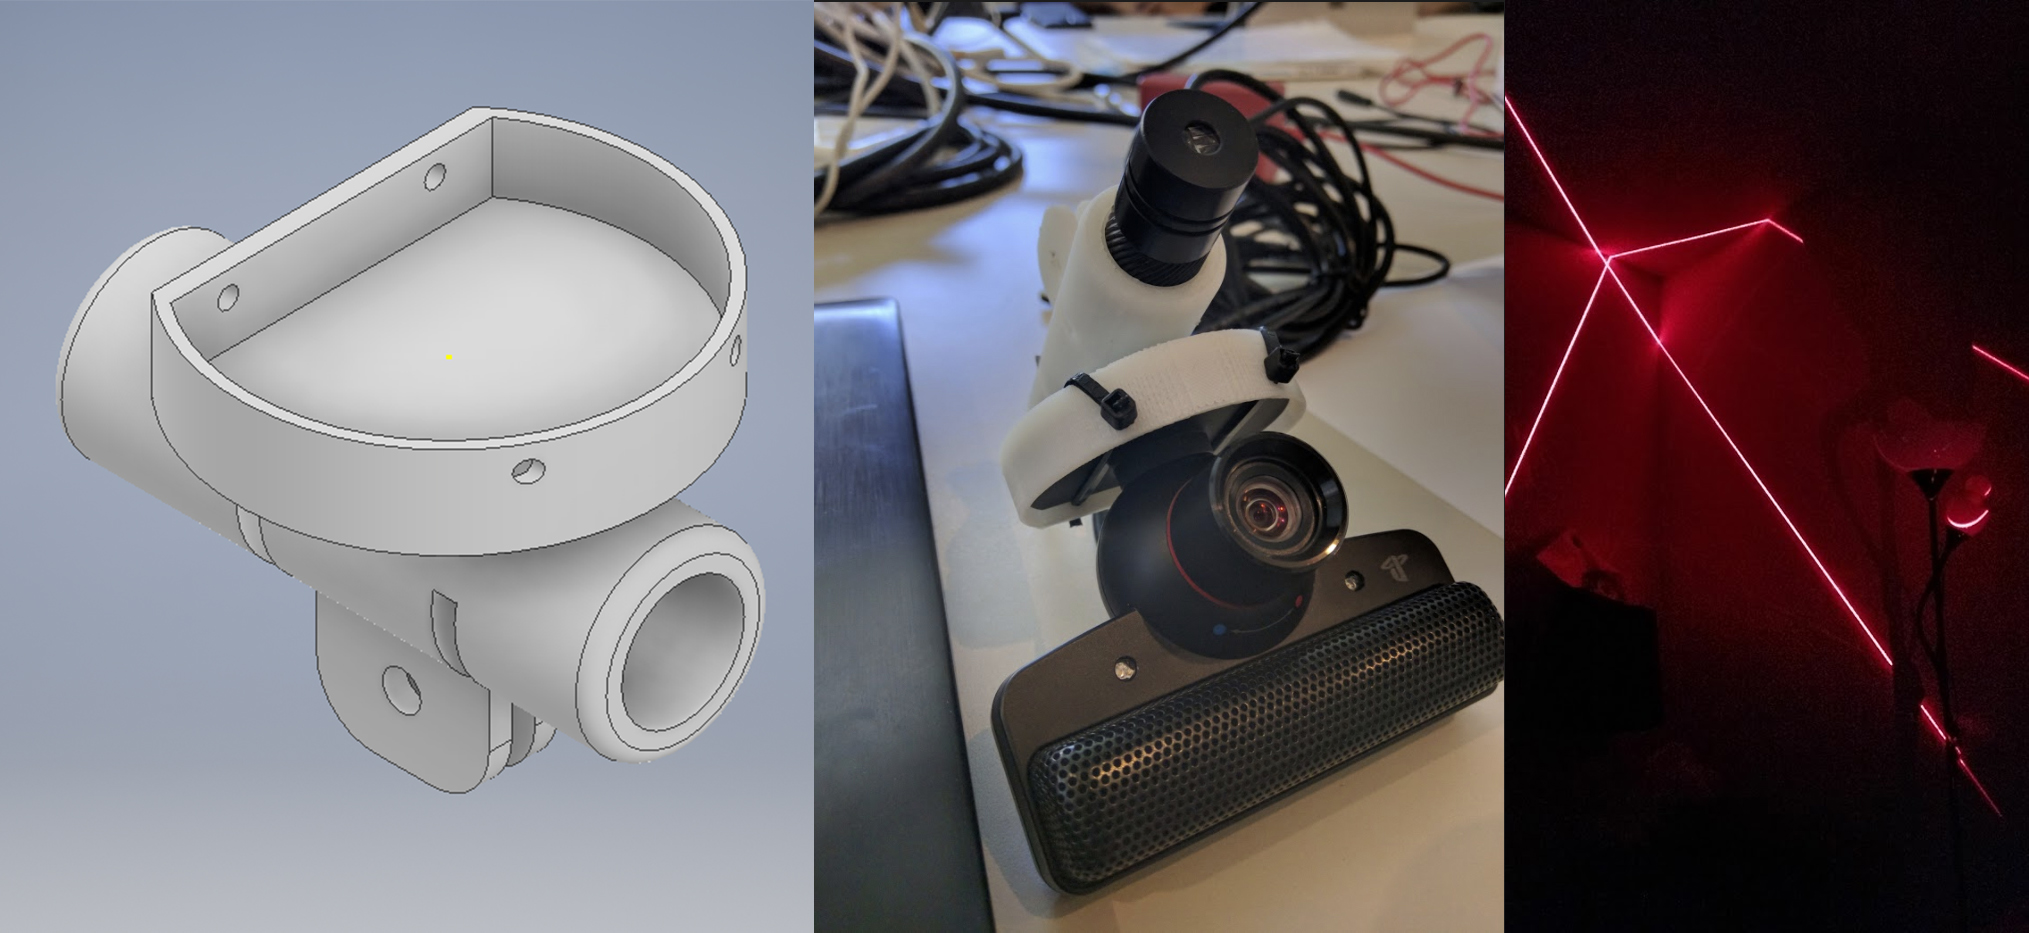
Ultimately, we did not have expertise in the team to implement this solution fully, but we did try edge detection and a few other algorithms in OpenCV. The smoothness filter did not give us very reliable readings and we had to concentrate on getting data from the IMU and other sensors, but it was an interesting look into the path less traveled.
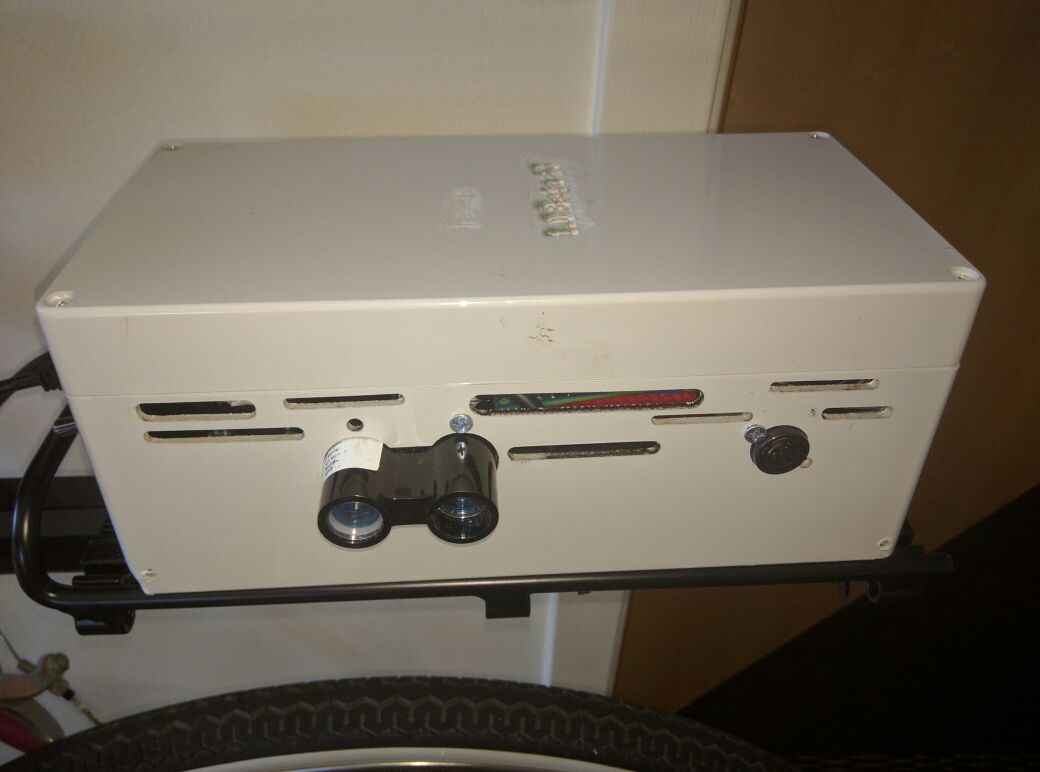
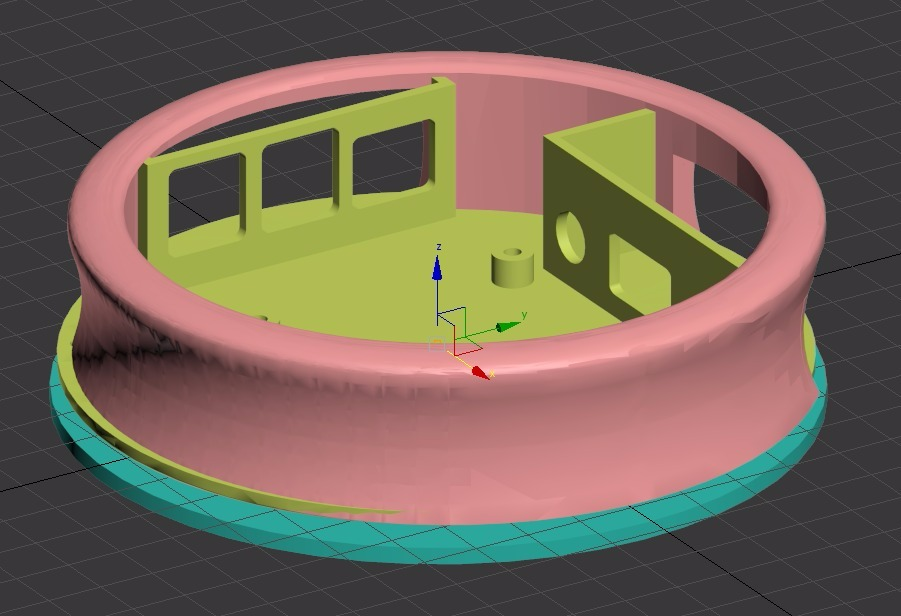
After we finalized on all the components, we had to build cases around them to protect them from the elements. Because these sensors go on bikes, we could not have exposed electronics. Therefore, we 3D printed some cases, laser cut some others, and put it all together.
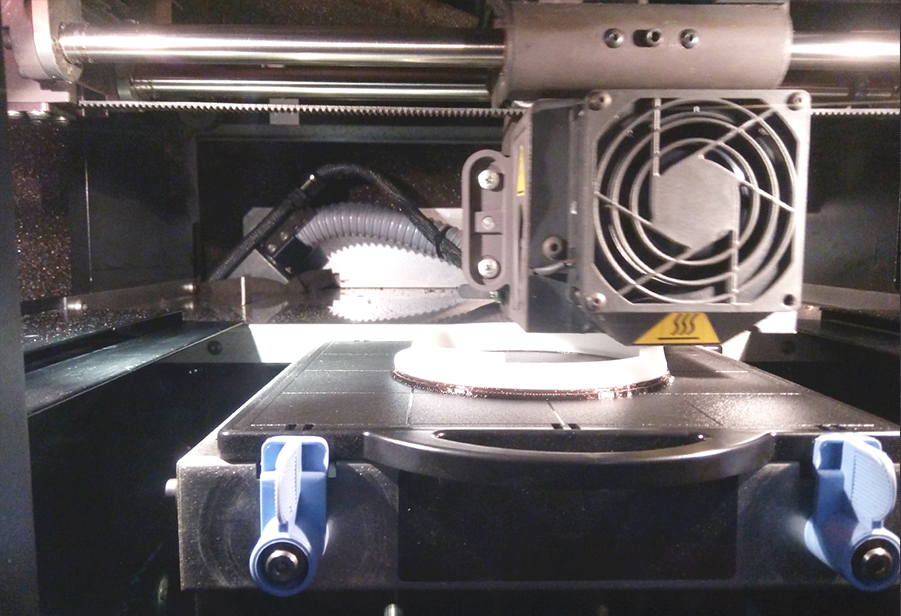
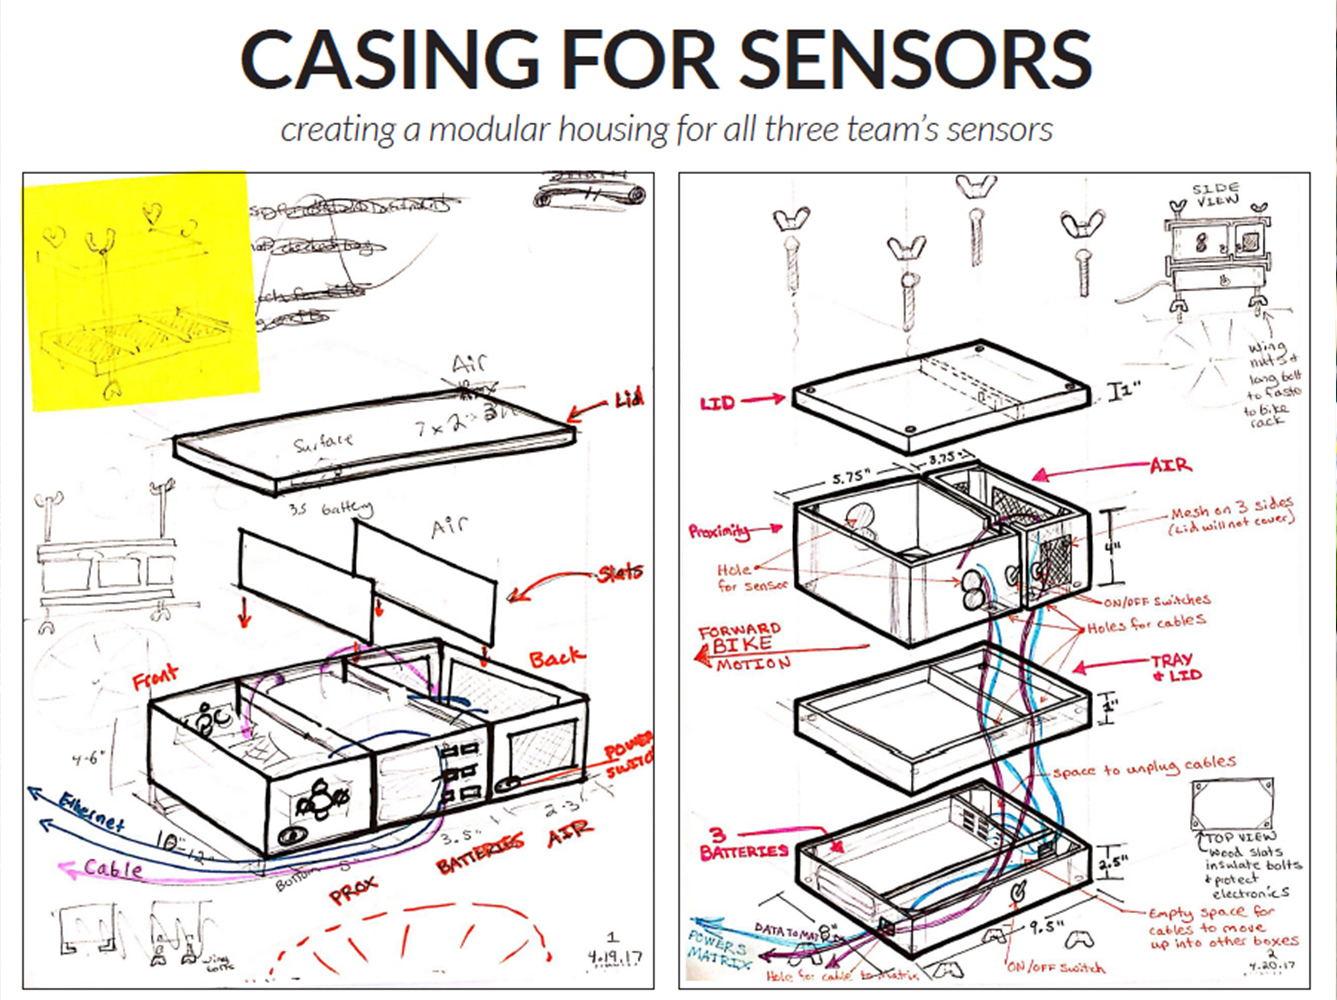

Finally, after making sure all the sensors work in a simulated environment and developing as three separate teams, it was time for us to actually mount everything on the bike and take it for a spin. We wanted to make sure everything works reliably, collects data and is physically strong enough to stay on the bike.
We started by networking the two Raspberry Pis. They communicated via a standard REST server / client mechanism, with the Matrix Pi acting as the server. The other Raspberry Pi collected data from the proximity sensors and air quality sensors and relayed that to the server at 1s intervals for proximity, 5s intervals for air quality.
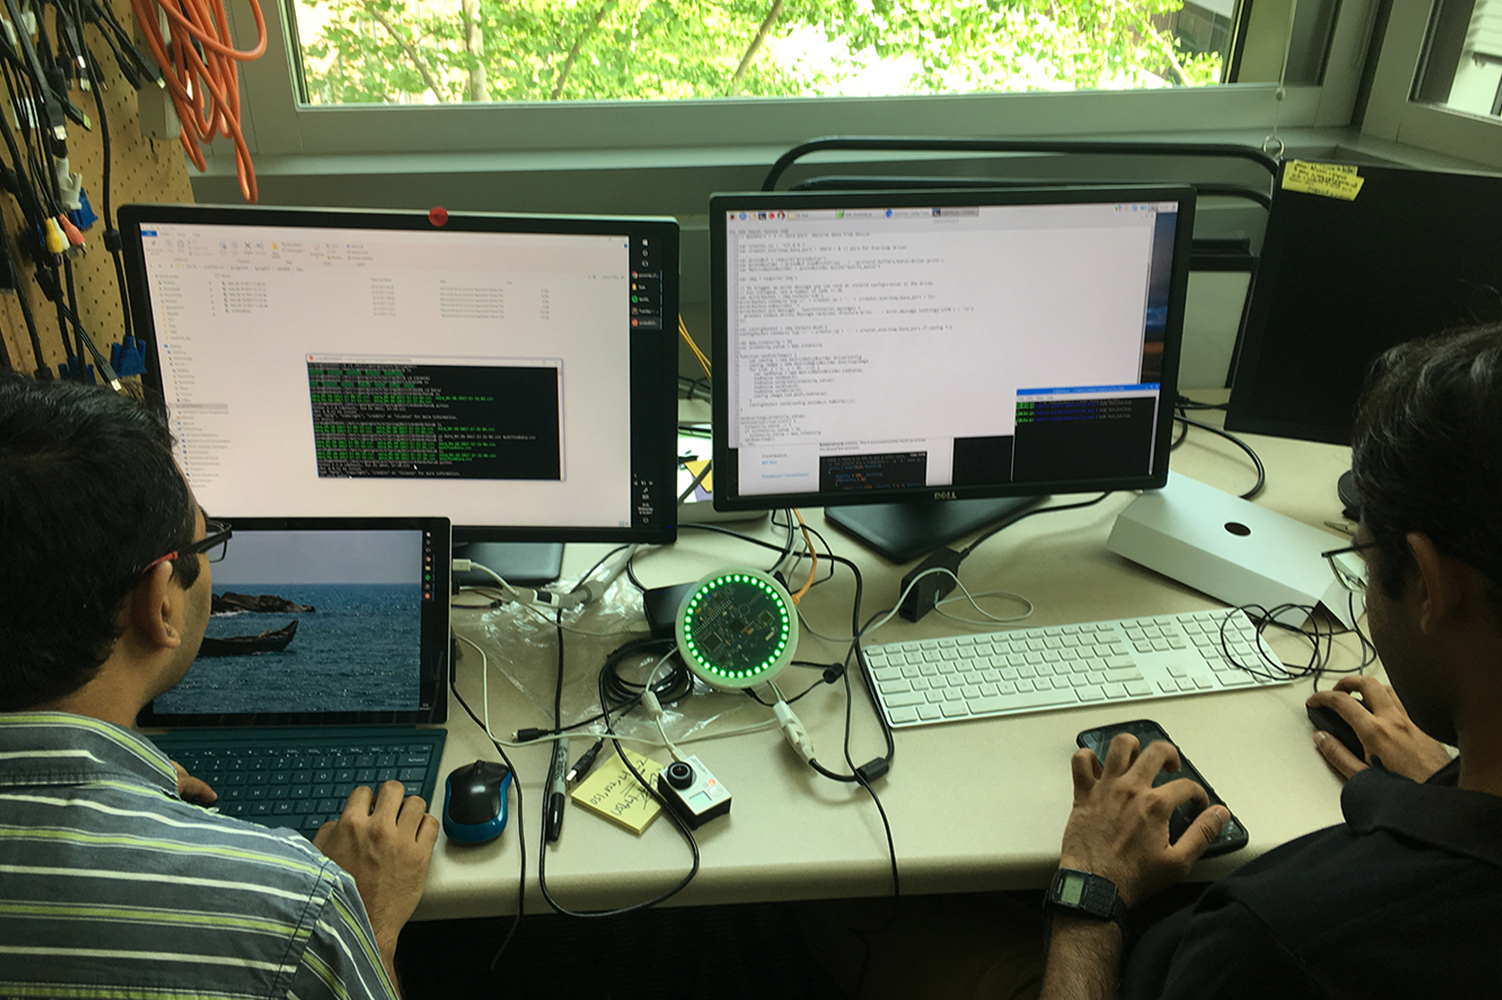
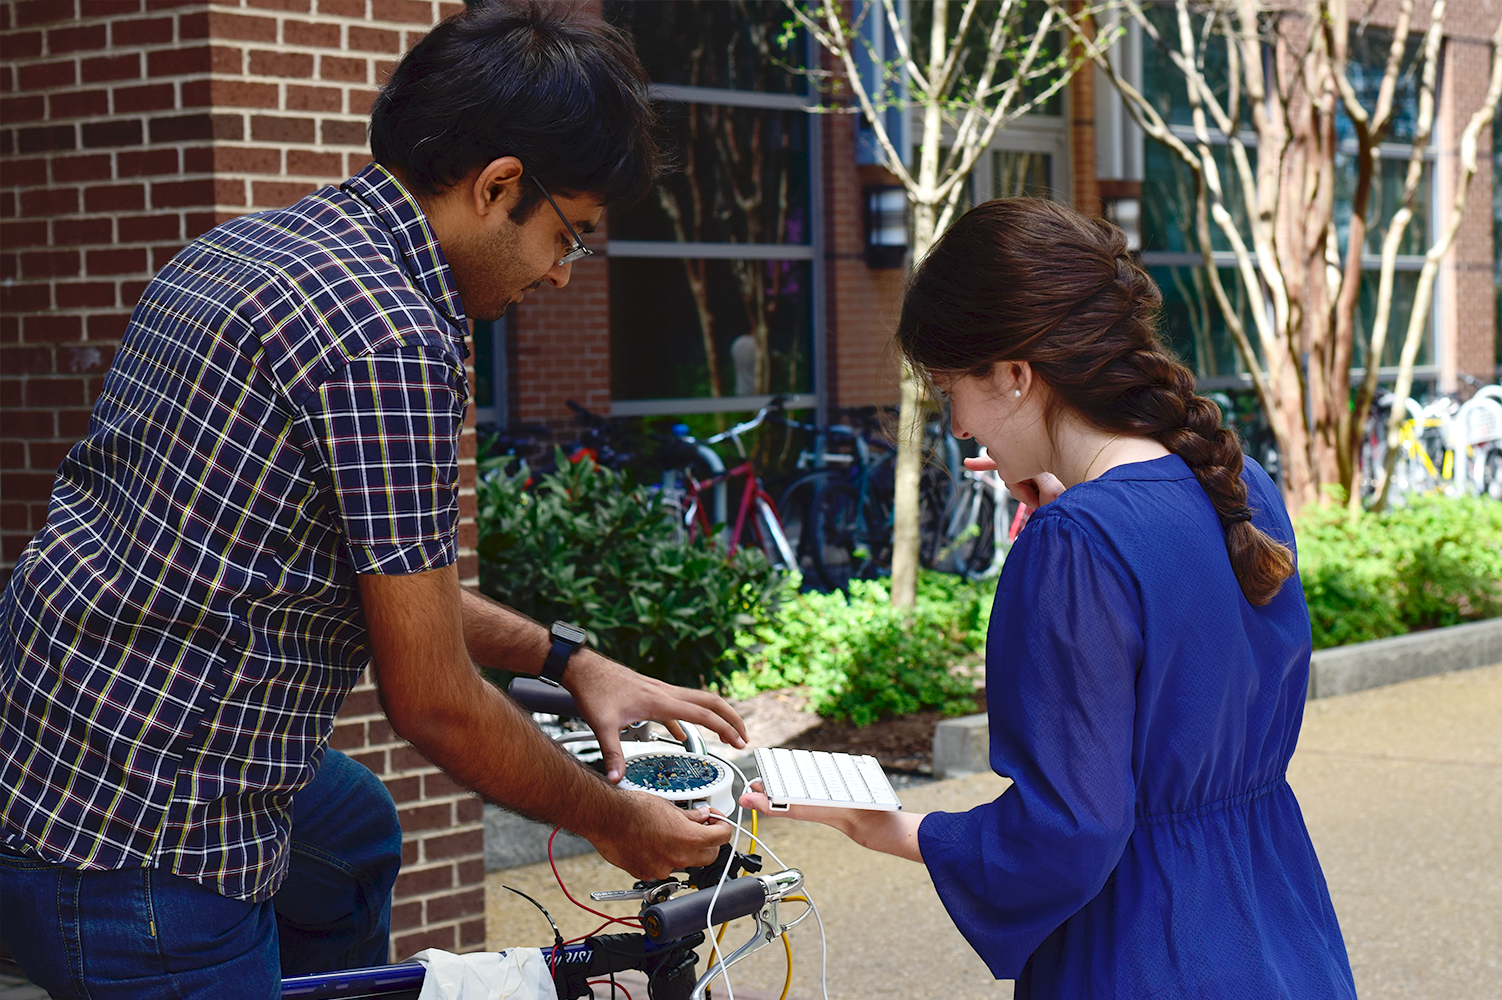
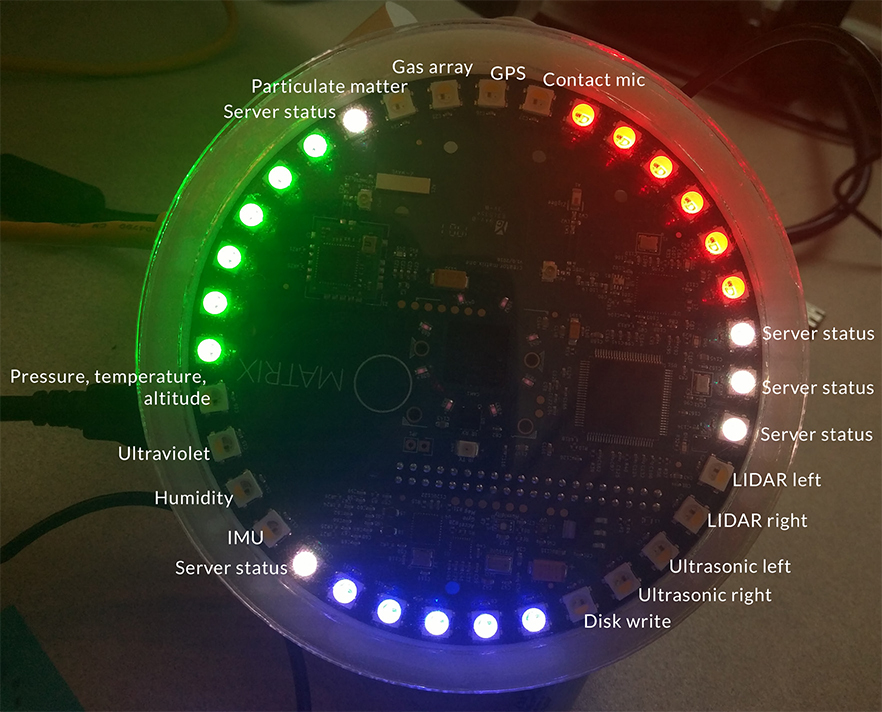
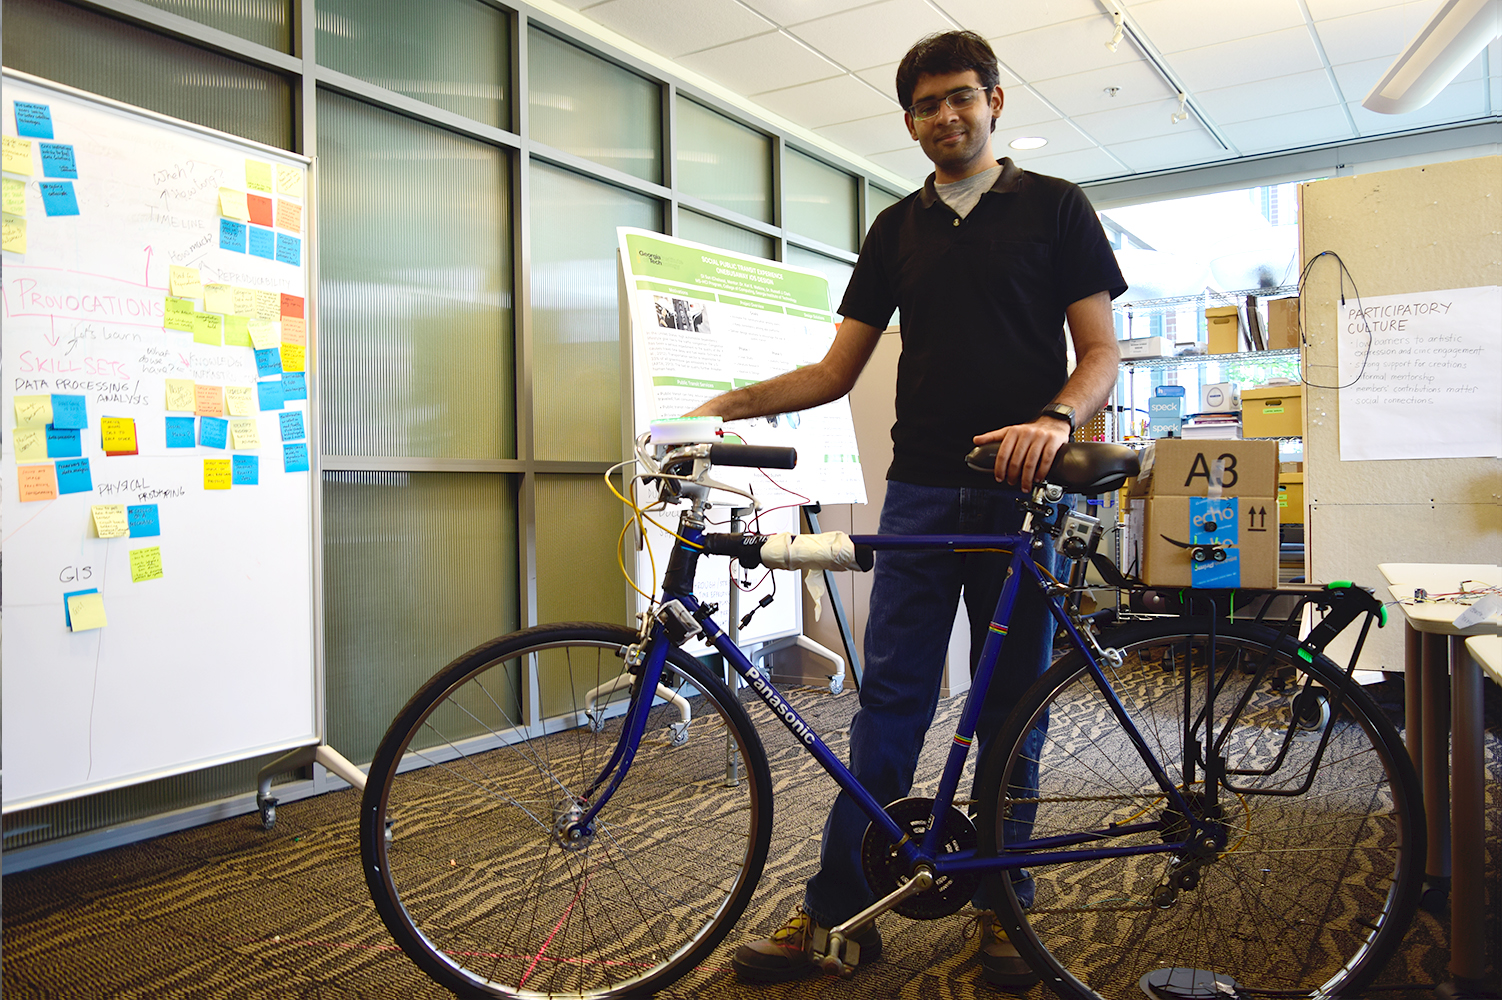
Next, we mounted everything on the bike to test for calibration and ruggedness. Pretty much everything worked as expected on the final prototype.
A major deliverable was the 'process book' that described our process in detail, explaining the alternatives we had considered, logic for chosing a particular method, list of equipment used, so on. It was, in essence, a recipe book if someone else wanted to build a similar system.
At the end of the class, we were able to build a fully functional prototype that attaches on a bike and collect data. In addition, we prototyped some enclosures and did preliminary data analysis to see if the data being collected made sense, and made a 'Process Book' explaining the choices we made and the steps to replicate our designs. The deliverables were well received and so far, we have not had any issues with our design (which is great, by design terms).
The following semester, Prof. LeDantec worked with other students to make the design more rugged and compact to go on bikes, and built several kits for distribution. Currently, the PIs are seeking more funding for effort, and looking for volunteers to ride roadways in order to provide the project with data.
